Kotodama Proxy Report: What 108M Parameters Taught Us
This report covers the full ablation study on Kotodama's 108M proxy model. Four interventions were tested — Muon optimizer, Neural Cellular Automata (NCA) pretraining, Attention Residuals (AttnRes), and co-trained data-driven routing — to determine which configuration to lock for 3B scaling. The answer is DDv1: NCA + co-trained AttnRes + Muon 0.02. This document explains why.
1. Setup
Architecture. 108M parameters. 512 hidden dim, 28 transformer layers, 4 query heads / 2 KV heads (GQA), SwiGLU activations, QK-norm, z-loss regularization. SmolLM2 tokenizer (49,152 vocab). All runs trained on 6B tokens of FineWeb-Edu.
The four interventions:
- Muon — A spectral optimizer that applies Newton's method in the spectral domain of weight matrices. Unlike AdamW, it optimizes the full singular value spectrum rather than individual parameters. The claim: same loss, better-conditioned weight geometry.
- NCA — Neural Cellular Automata pretraining. Before language training, the model processes cellular automata data (local spatial patterns) for 300M–850M tokens. The claim: NCA forces attention heads to specialize for local context before they encounter language.
- AttnRes — Attention Residuals. Blocks are grouped, and attention outputs within each group share a running residual that bypasses the block-level stream. The claim: this gives attention circuits dimensional headroom to represent richer structure without competing with the MLP pathway.
- Co-training — Instead of adding AttnRes fresh at the language transition, co-train the AttnRes routing weights during NCA itself. The claim: the routing learns useful structure from NCA's spatial patterns, eliminating a costly warmup phase.
Checkpoint lineage:
| Name | Config | NCA | AttnRes | Loss | PPL |
|---|---|---|---|---|---|
| P1-AdamW | AdamW lr=8e-4 | -- | -- | 2.925 | 18.63 |
| P3-Muon | Muon lr=0.02 + AdamW lr=6e-4 | -- | -- | 2.925 | 18.62 |
| NCA-002 | Muon 0.02 | 300M seed42 | -- | 2.931 | 18.67 |
| P3-AttnRes | Muon 0.02 | -- | N=7 fresh | 2.870 | 18.12 |
| NCA-AttnRes | Muon 0.02 | 300M seed42 | N=7 fresh | 2.886 | 18.25 |
| Lang-Baseline | Muon 0.02 | 721M seed17 | N=4 fresh | 2.892 | 18.04 |
| Lang-DDv1 | Muon 0.02 | 852M seed17 | DD-v1 co-trained | 2.899 | 18.15 |
All losses are within a 0.06 nat window. Whatever these interventions change, it isn't next-token prediction loss.
2. Muon: Same Loss, Different Geometry
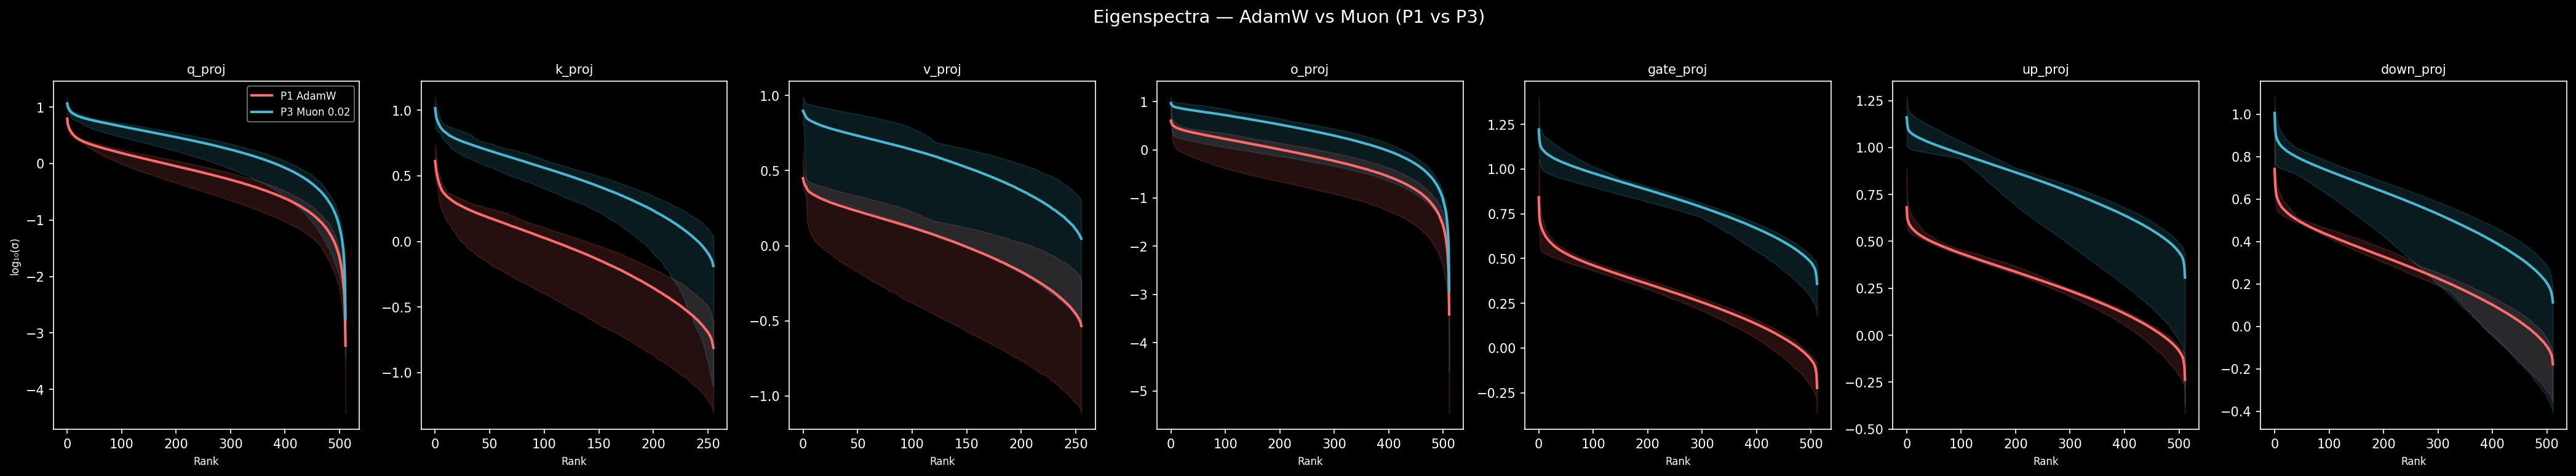
P3-Muon and P1-AdamW reach identical evaluation loss (2.925 nats). On the surface, the optimizer choice doesn't matter. But look at the weight matrices.
Muon maintains broader singular value spectra across all attention projections — the participation ratio (a measure of effective rank: how many singular values contribute meaningfully, distinct from the wandb stable rank formula used in training curves — see appendix) is 1.04–1.18x higher for Muon across q/k/v/o projections, with individual layers reaching up to 1.42x. The effect is concentrated in q_proj and o_proj, the projections that control what the model attends to and what it does with that attention. MLP projections are nearly identical (1.04x mean) — a pattern that holds at every intervention step in this ablation, not just the optimizer.
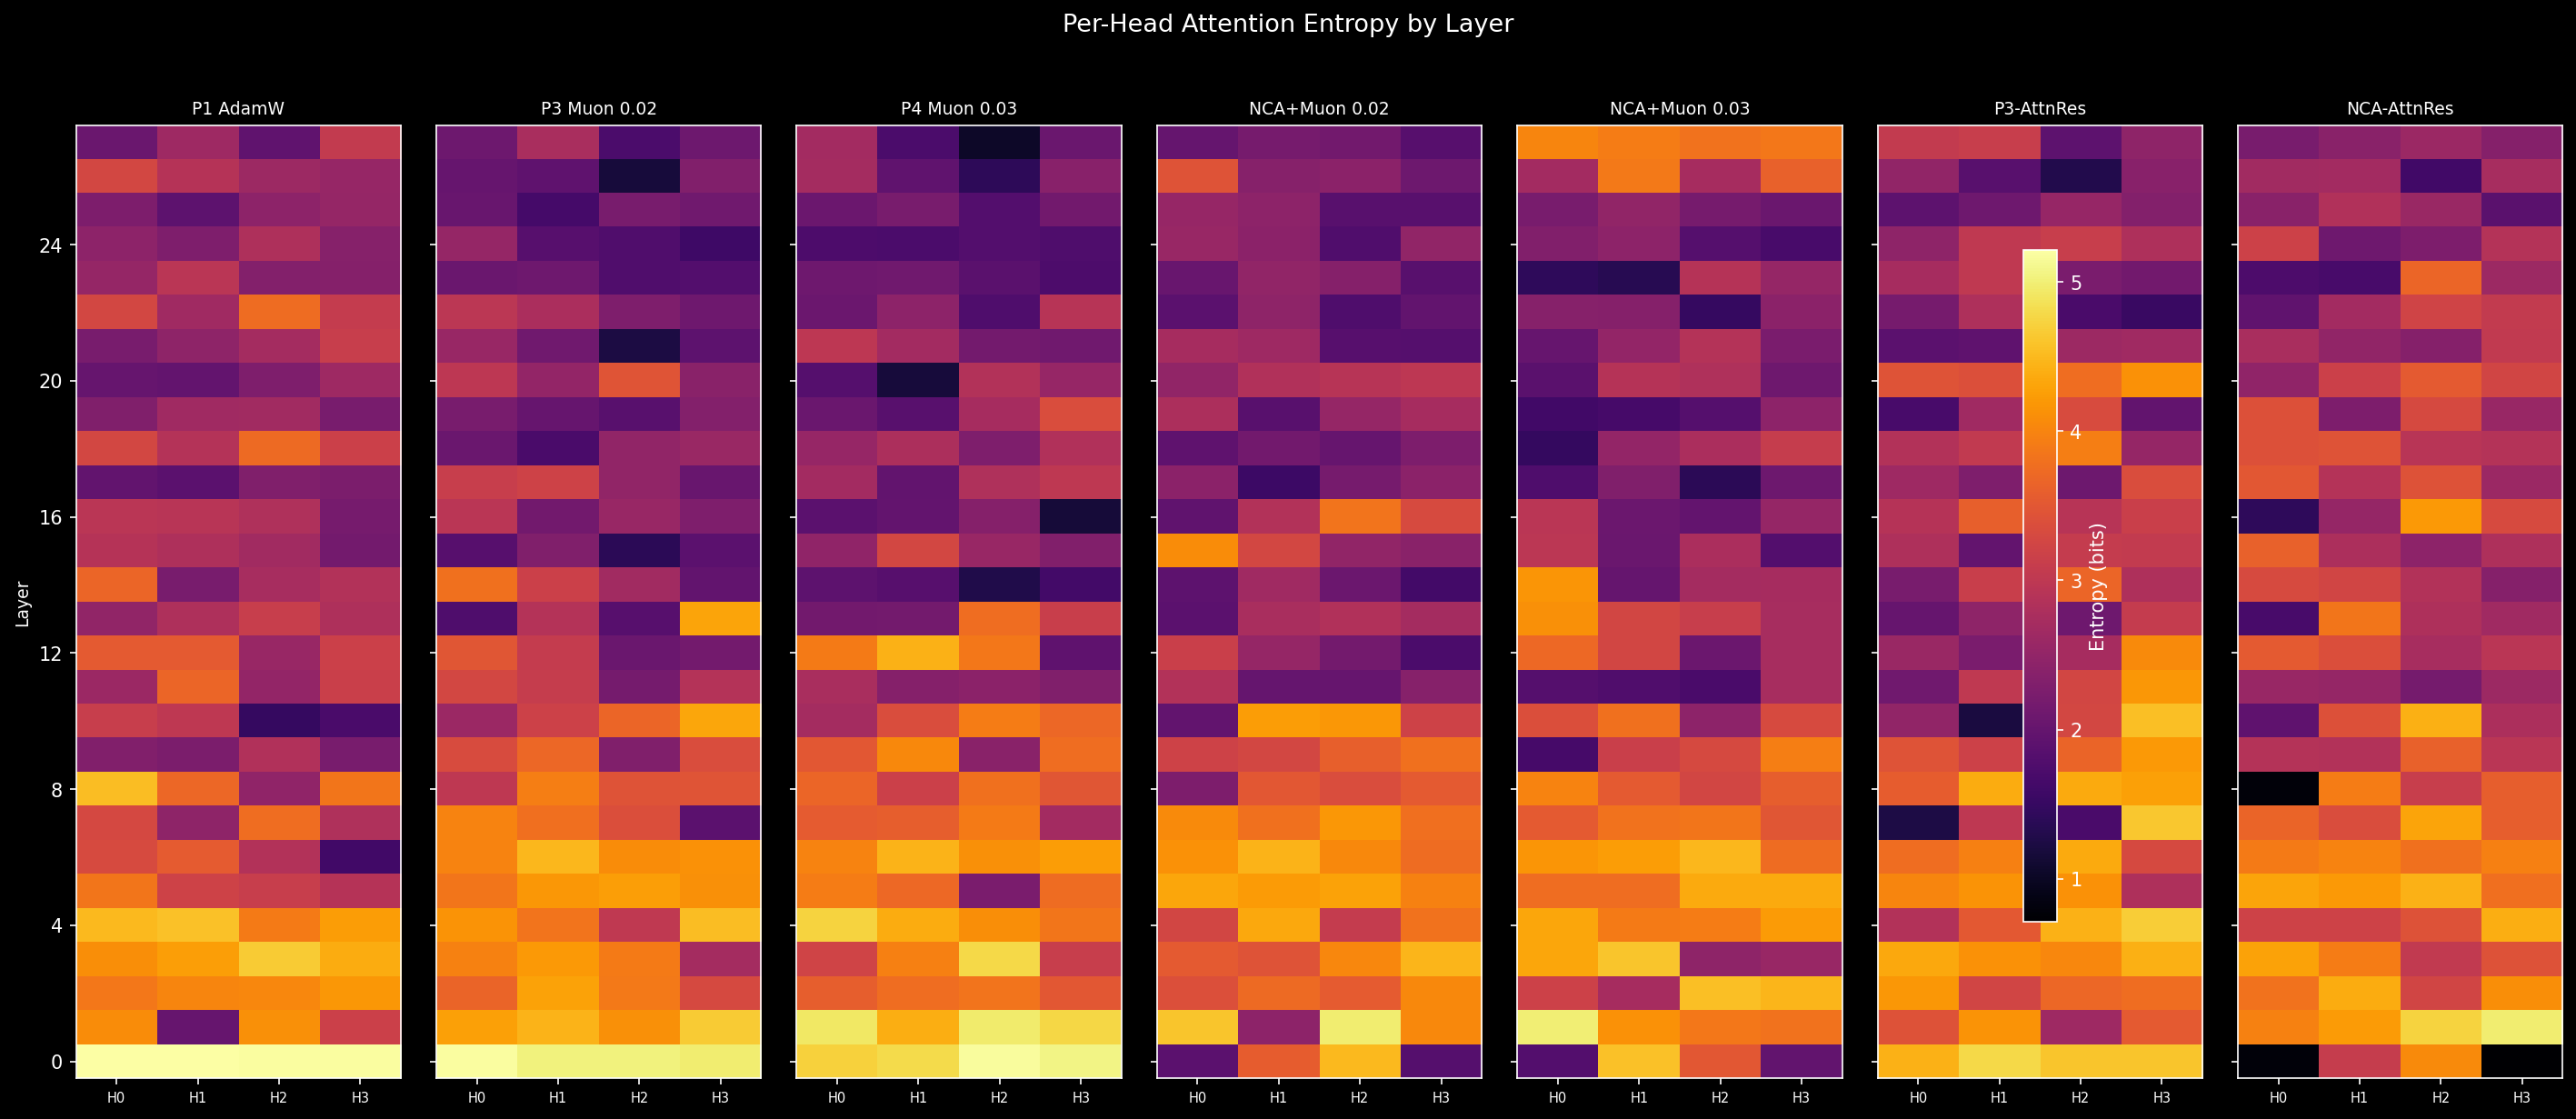
This sounds modest, and it is. At the head entropy level, the story is even subtler. At layer 0:
| Config | H0 | H1 | H2 | H3 | Mean | Std |
|---|---|---|---|---|---|---|
| P1-AdamW | 5.20 | 5.21 | 5.19 | 5.19 | 5.20 | 0.01 |
| P3-Muon | 5.19 | 5.03 | 5.04 | 4.97 | 5.06 | 0.08 |
Both are near-maximum entropy. All four heads attend to everything uniformly. Muon creates a tiny crack in this uniformity (std 0.08 vs 0.01), but functionally, both models enter language training with undifferentiated attention.
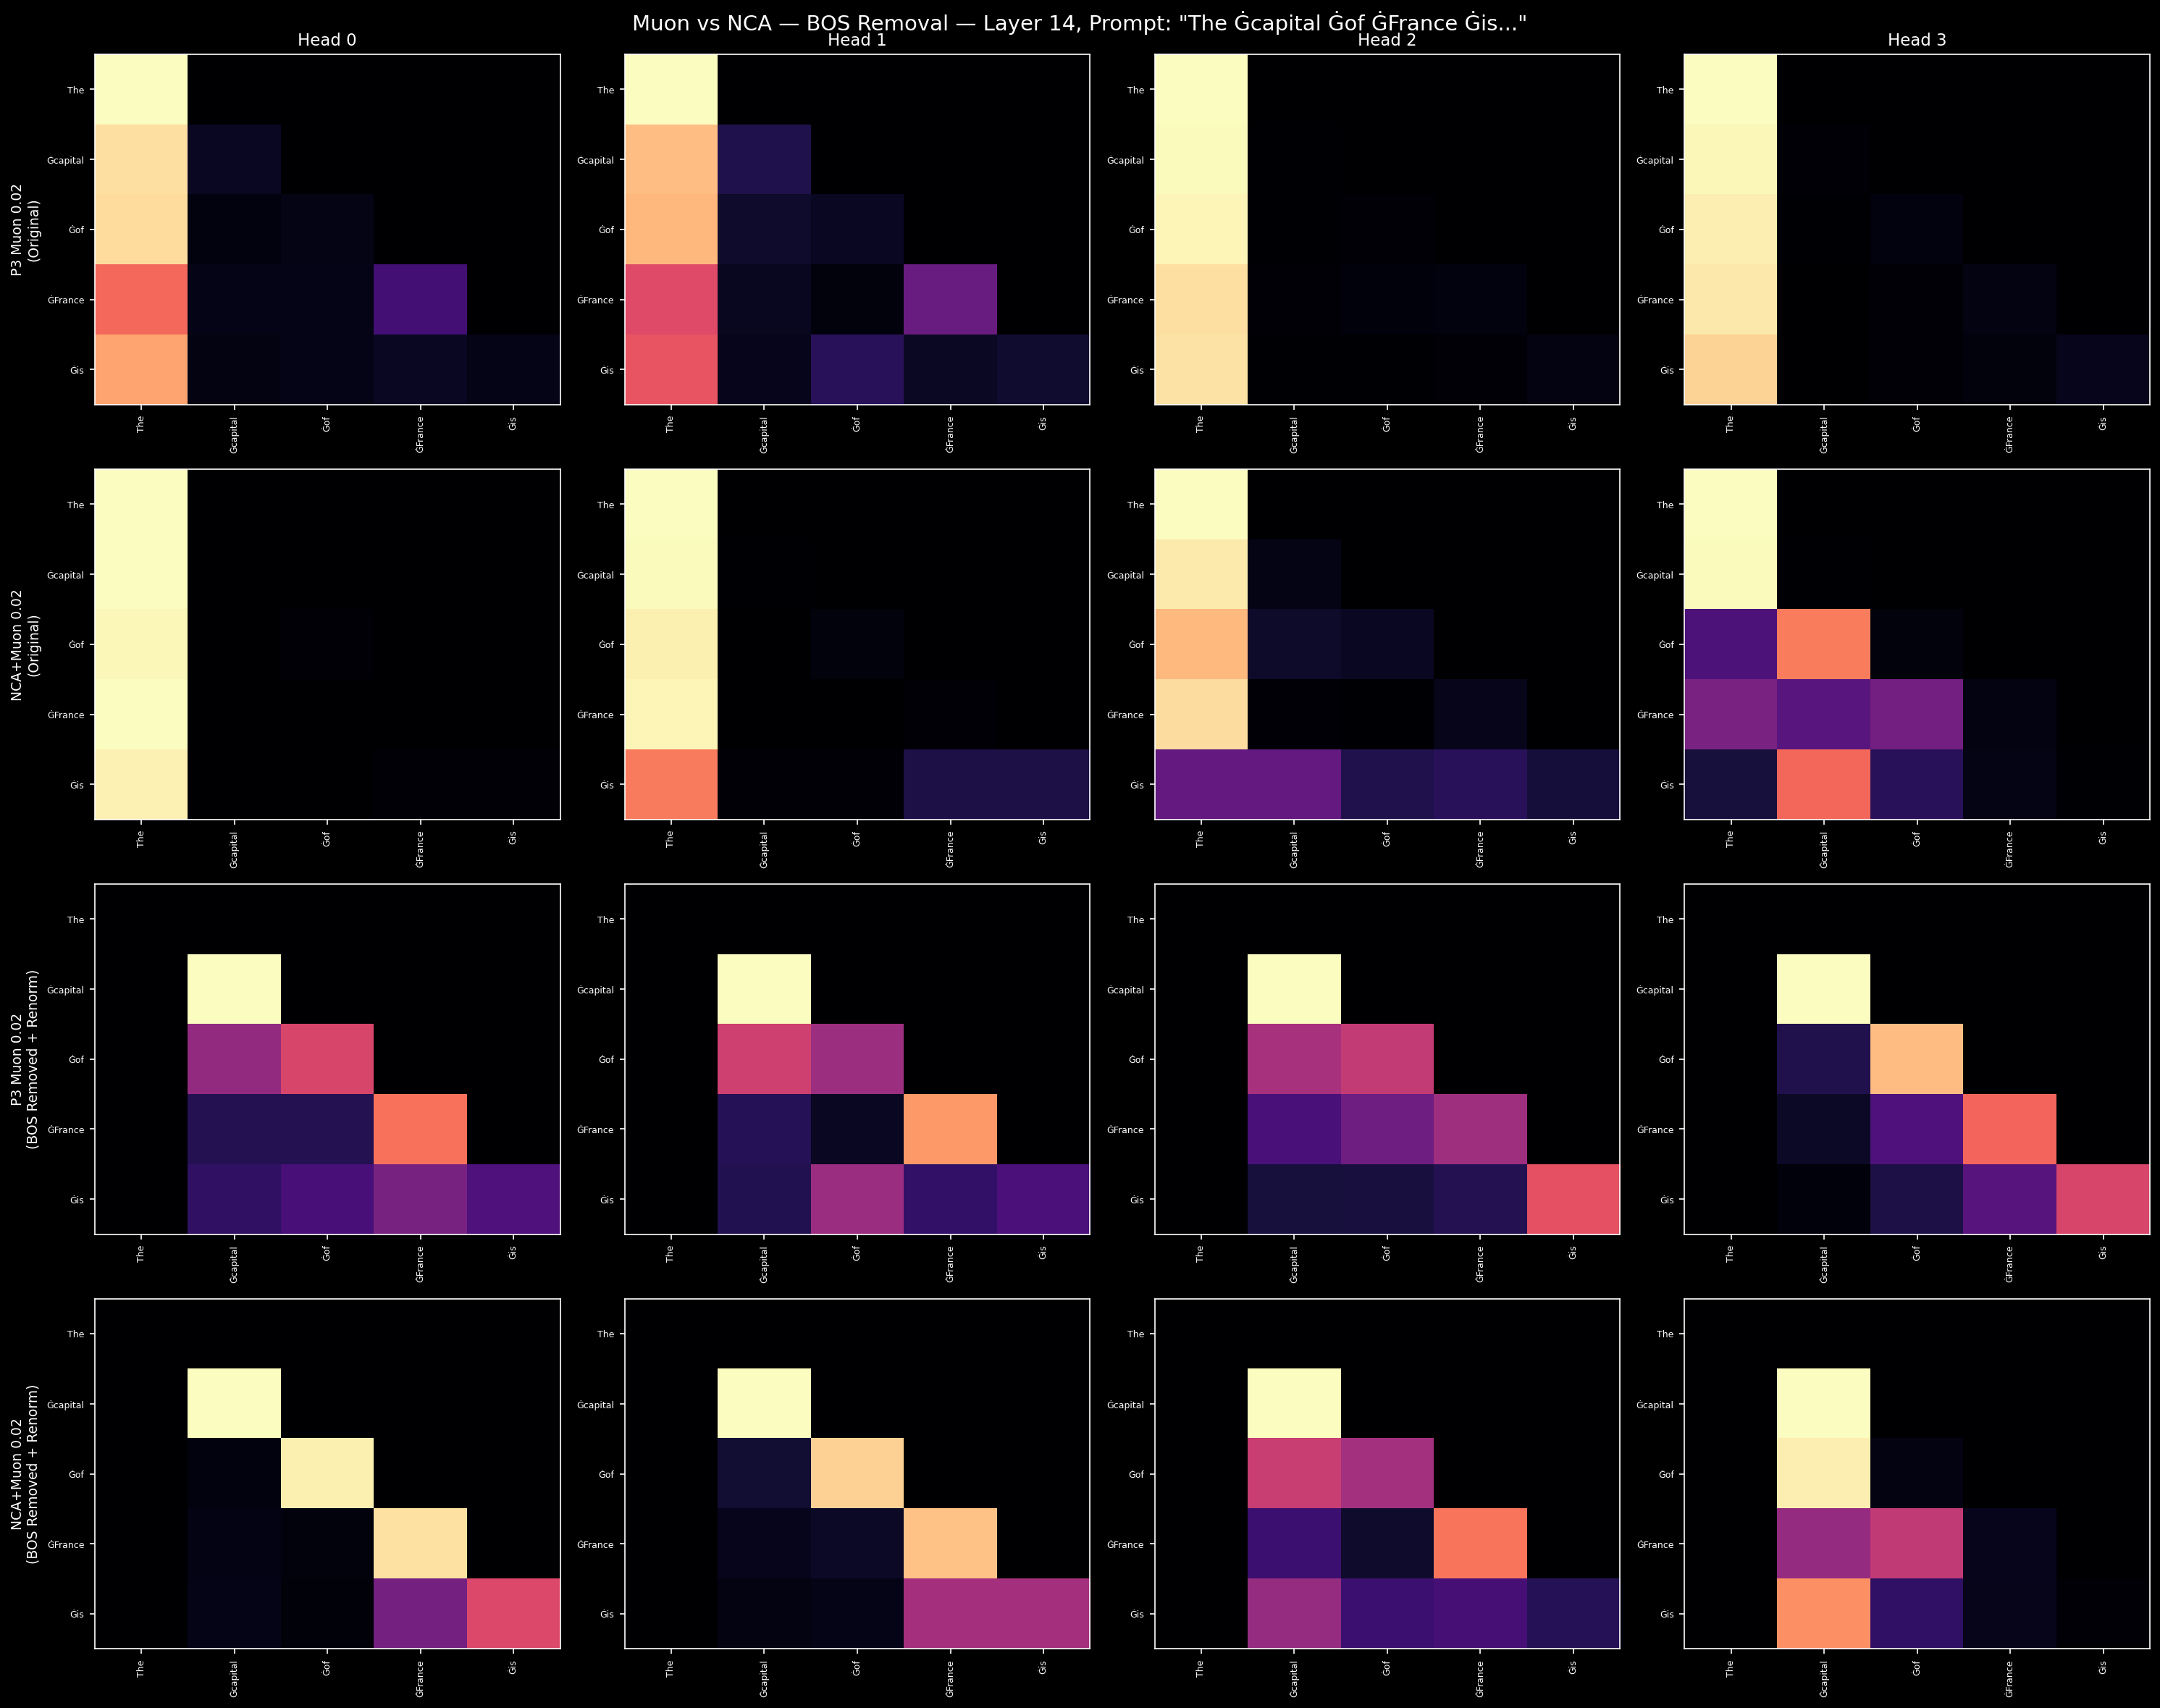
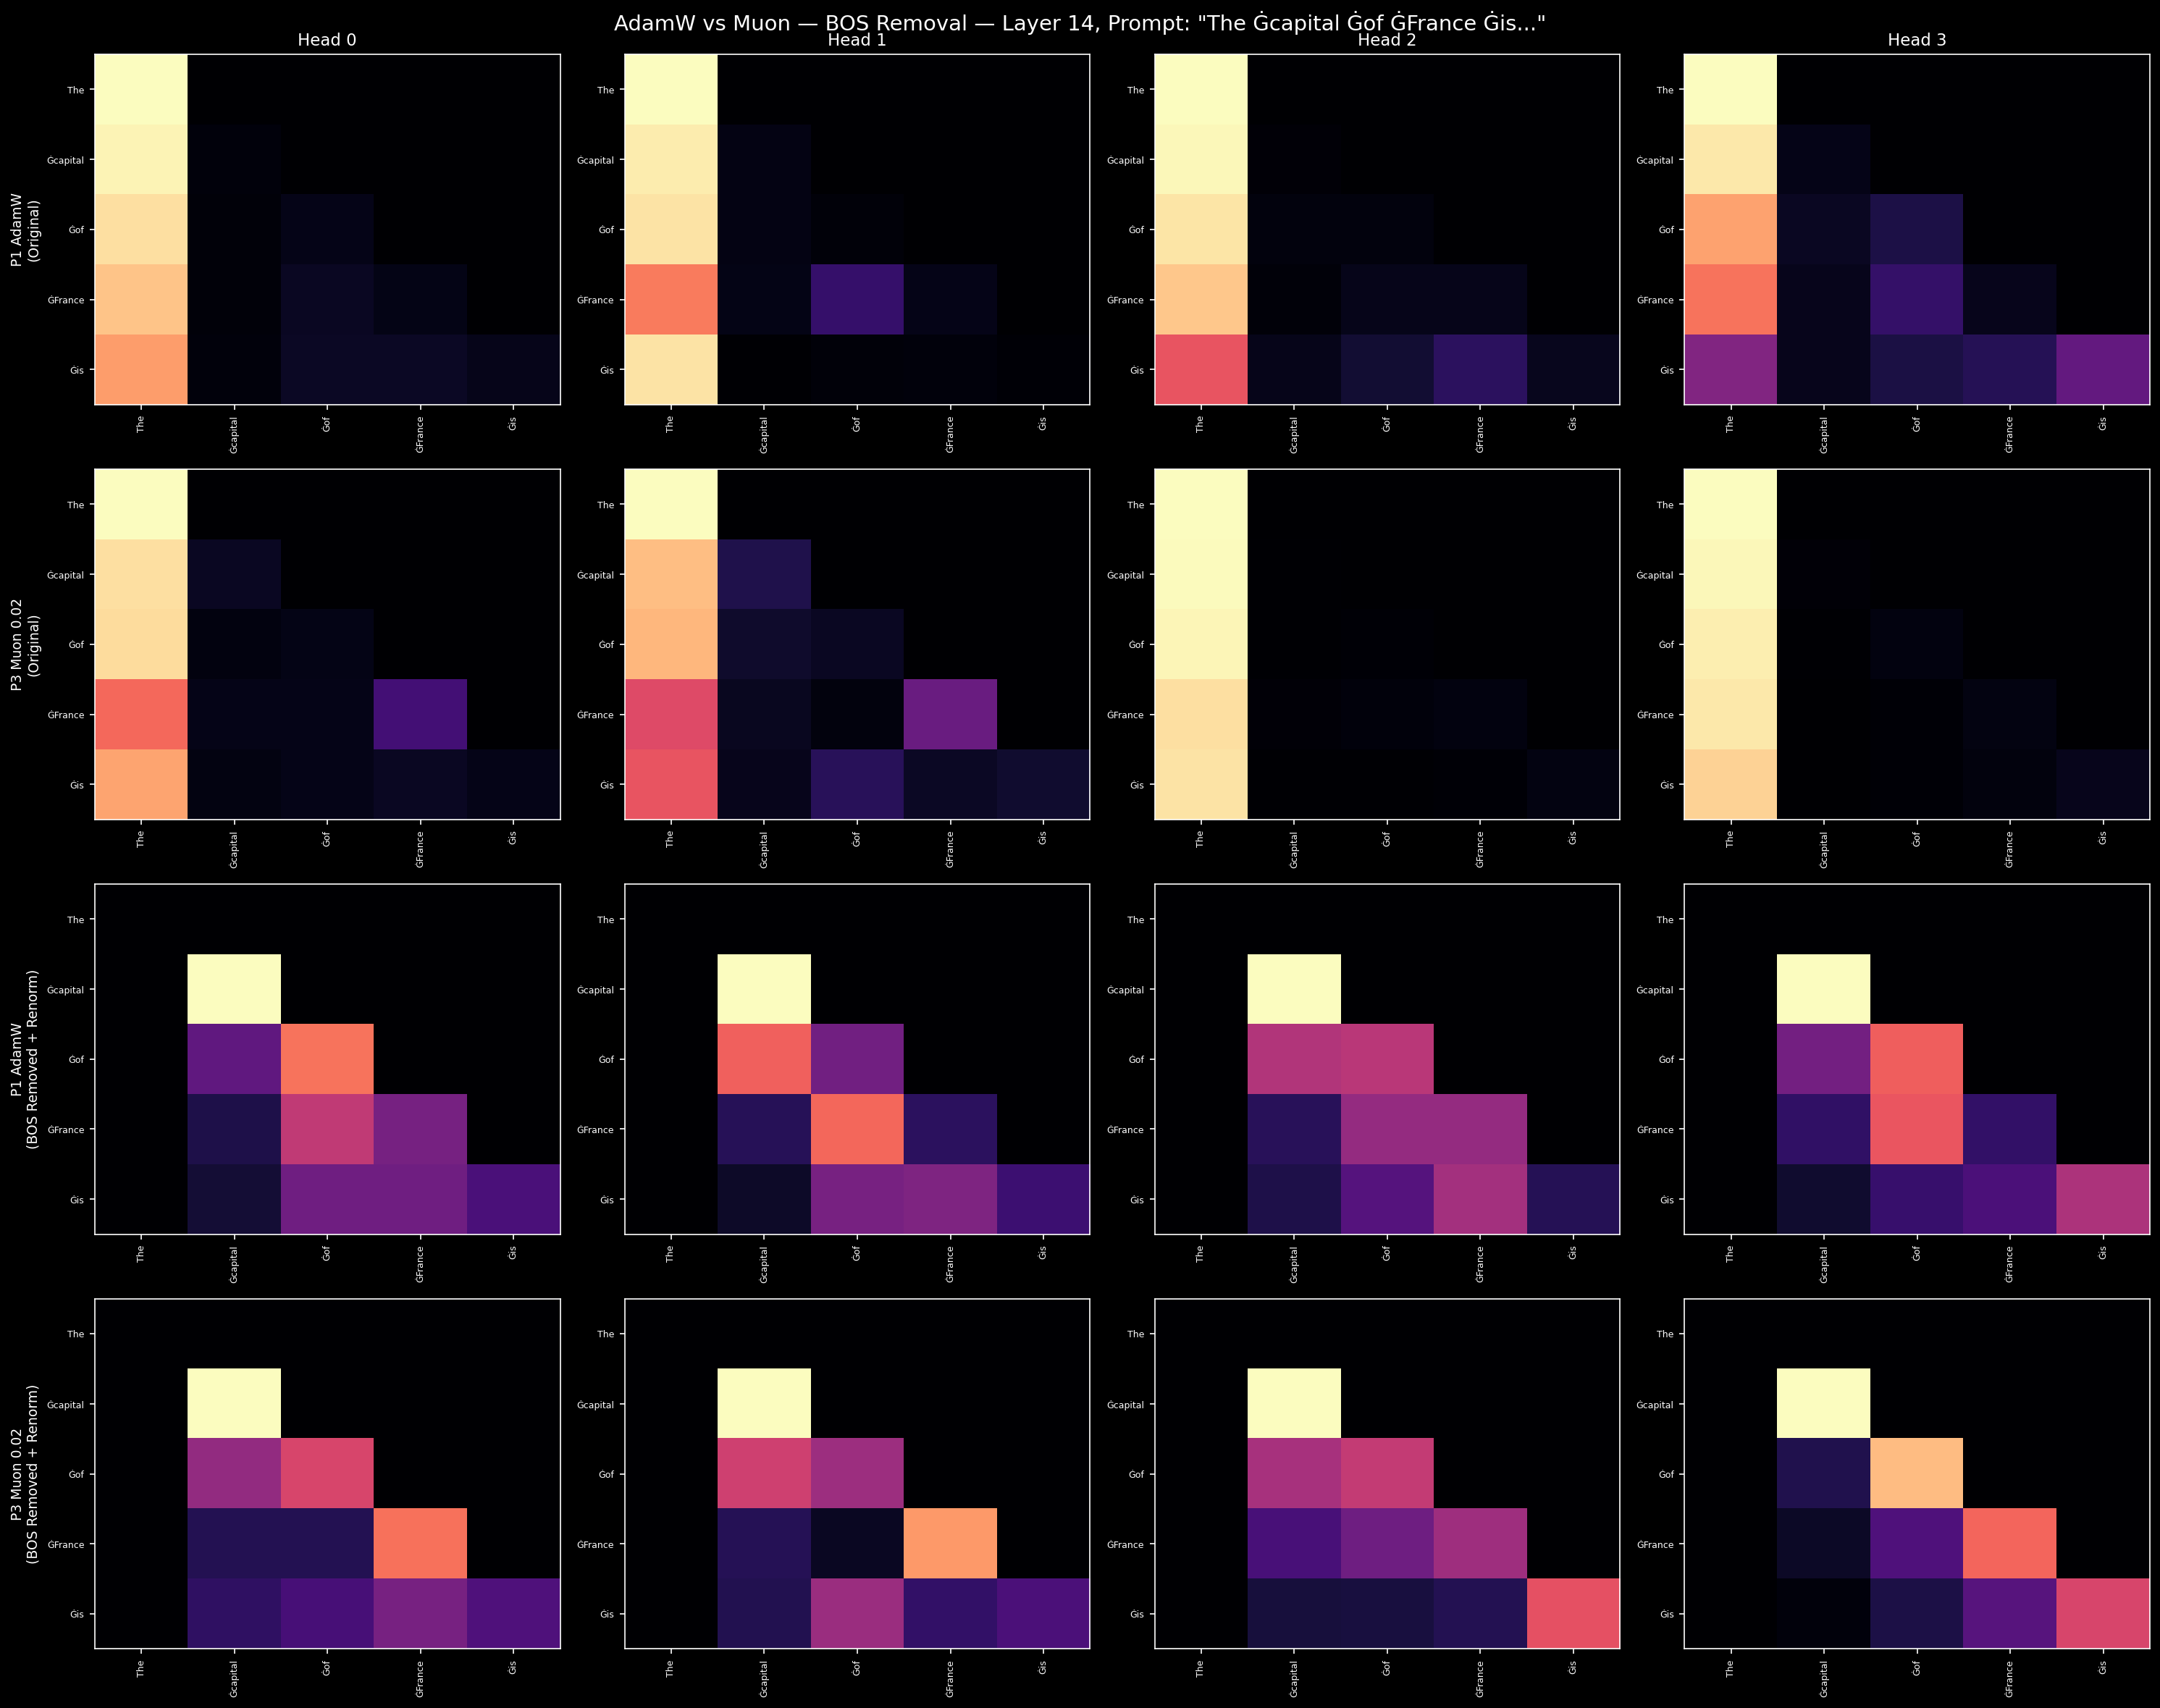
At L14, we can see what this uniformity costs. Measuring the fraction of attention mass that concentrates on the BOS (first) token:
| Config | L14 BOS mass |
|---|---|
| P1-AdamW | 81.7% |
| P3-Muon | 86.2% |
Over 80% of attention at layer 14 goes to a single token. These intermediate layers are effectively disabled as information-processing units. Muon doesn't fix this — if anything, it slightly concentrates the BOS-sink further.
What Muon provides is not an immediate structural advantage. It's a precondition: weight matrices with broader spectral support, which means more directions in parameter space available for downstream interventions to exploit.
3. NCA: Rewiring Attention Circuits
Why cellular automata? The NCA phase trains on discrete cellular automata running on 64×64 grids with 8 state channels, filtered for Class IV (edge-of-chaos) dynamics via gzip compression scoring. Class IV rules produce the richest possible behavior: long-range information propagation through local interactions, multi-scale hierarchical structure, and context-sensitive state transitions where the same local pattern means different things depending on its neighborhood. The transition network uses a 3×3 convolution kernel — a local perception field that maps directly onto the kind of local context sensitivity that attention heads need for language. Grids are tokenized as 2×2 patches (~10,000 token vocabulary), and the model trains on 64–256 step trajectories of these dynamics.
The hypothesis is that NCA bootstraps computational scaffolding before content. After NCA pretraining, the model has learned in-context rule inference on spatiotemporal patterns — attention circuits with form but no semantic content. The multi-channel grid dynamics (8 parallel state channels) require tracking multiple independent information threads, which maps to head specialization. The gzip complexity filter ensures the patterns are neither trivially periodic (too simple for the model to need structure) nor chaotically random (too noisy to learn from), sitting in the regime where the model must develop genuine local-to-global computational strategies. At 300–850M tokens, this costs less than 0.5% of the total training budget.
Whether this specific hypothesis is correct — that Class IV NCA dynamics teach attention heads to specialize — or whether the effect comes from something simpler (any structured non-language data would do), is not resolved by this ablation. What is resolved is that NCA pretraining produces measurably different attention geometry. The question of why remains open for 3B.
NCA pretraining transforms the attention layer. Where Muon produced a subtle spectral shift, NCA produces a qualitative phase change.
The layer 0 head entropy table, now with NCA:
| Config | H0 | H1 | H2 | H3 | Mean | Std |
|---|---|---|---|---|---|---|
| P3-Muon | 5.19 | 5.03 | 5.04 | 4.97 | 5.06 | 0.08 |
| NCA-002 | 1.90 | 3.57 | 4.51 | 1.83 | 2.95 | 1.14 |
The standard deviation jumps 14x. Two heads (H0, H3) have become sharply specialized — entropy below 2.0, meaning they attend to a handful of positions rather than spreading mass uniformly. Two others remain broader. NCA's cellular automata training, which requires 3×3 and 5×5 local perception kernels, forces heads to develop distinct receptive fields. After NCA, the model has functionally differentiated attention heads before it sees a single word of language.
The weight matrices tell the same story in more detail. The output projection at L0 (o_proj, the matrix that mixes attention outputs back into the residual stream) shows the largest NCA signature of any measurement in the ablation: participation ratio of 172 effective dimensions under NCA versus 9–10 under standard training — an 18x difference. This isn't just “broader spectra”; it's a regime change. Standard models collapse o_proj to a near-rank-1 operation, funneling all attention output through a single direction. NCA preserves the full mixing — each specialized head's output contributes independently to the residual stream rather than being squeezed through a bottleneck. The q_proj (what the model attends to) shows a more modest 1.6–1.9x advantage. The pattern is consistent: NCA's effect is concentrated on the attention side, with MLP projections barely changing.
The BOS-sink responds to this rewiring:
| Config | L14 BOS mass |
|---|---|
| P3-Muon | 86.2% |
| NCA-002 | 75.3% |
NCA reduces BOS concentration at L14 by 11 percentage points. It's a meaningful start — the specialized heads are routing attention to content tokens rather than parking everything on BOS. But 75% is still substantial. At 512 hidden dimensions, the model doesn't have enough capacity to fully capitalize on the head rewiring. NCA provides the geometric substrate; the model needs more room to use it.
4. AttnRes: Dimensional Headroom (When You Earn It)
Attention Residuals group blocks and give each group's attention outputs a shared bypass around the main residual stream. The motivation is straightforward: in a standard transformer, attention and MLP outputs compete for the same residual dimensions. AttnRes gives attention its own channel, so attention can build richer representations without interfering with the MLP pathway.
At 108M parameters with 512 hidden dimensions, this creates a capacity tension. The 2×2 factorial (NCA × AttnRes) reveals a striking interaction.
The BOS-sink, across all configurations:
| Config | L0 | L14 | L27 | NCA? | AttnRes? |
|---|---|---|---|---|---|
| P3-Muon | 22.7% | 86.2% | 72.6% | -- | -- |
| P1-AdamW | 20.8% | 81.7% | 44.2% | -- | -- |
| NCA-002 | 9.2% | 75.3% | 82.5% | Yes | -- |
| NCA-AttnRes | 8.6% | 59.2% | 92.5% | Yes | Yes |
| NCA-003 | 9.4% | 55.3% | 58.3% | Yes | -- |
| P3-AttnRes | 22.1% | 52.4% | 84.3% | -- | Yes |
| Lang-DDv1 | 25.6% | 51.8% | 63.4% | Yes | Co-trained |
| Lang-Baseline | 23.8% | 89.8% | 90.3% | Yes | Fresh |
The L14 story reads clearly: standard models without AttnRes concentrate 82–86% of attention on BOS. NCA alone reduces this to 75%. AttnRes models cut it roughly in half (52–59%), regardless of whether NCA is present. And co-training preserves this protection even after 6B additional language tokens — Lang-DDv1 stays at 52% where Lang-Baseline climbs to 90%.
At L27 (the final layer), the pattern inverts: AttnRes models show higher BOS concentration. This is a different phenomenon — attention to BOS at the last layer functions as a "register read" rather than a pathological sink. The pathology is at L14, where BOS concentration disables intermediate computation.
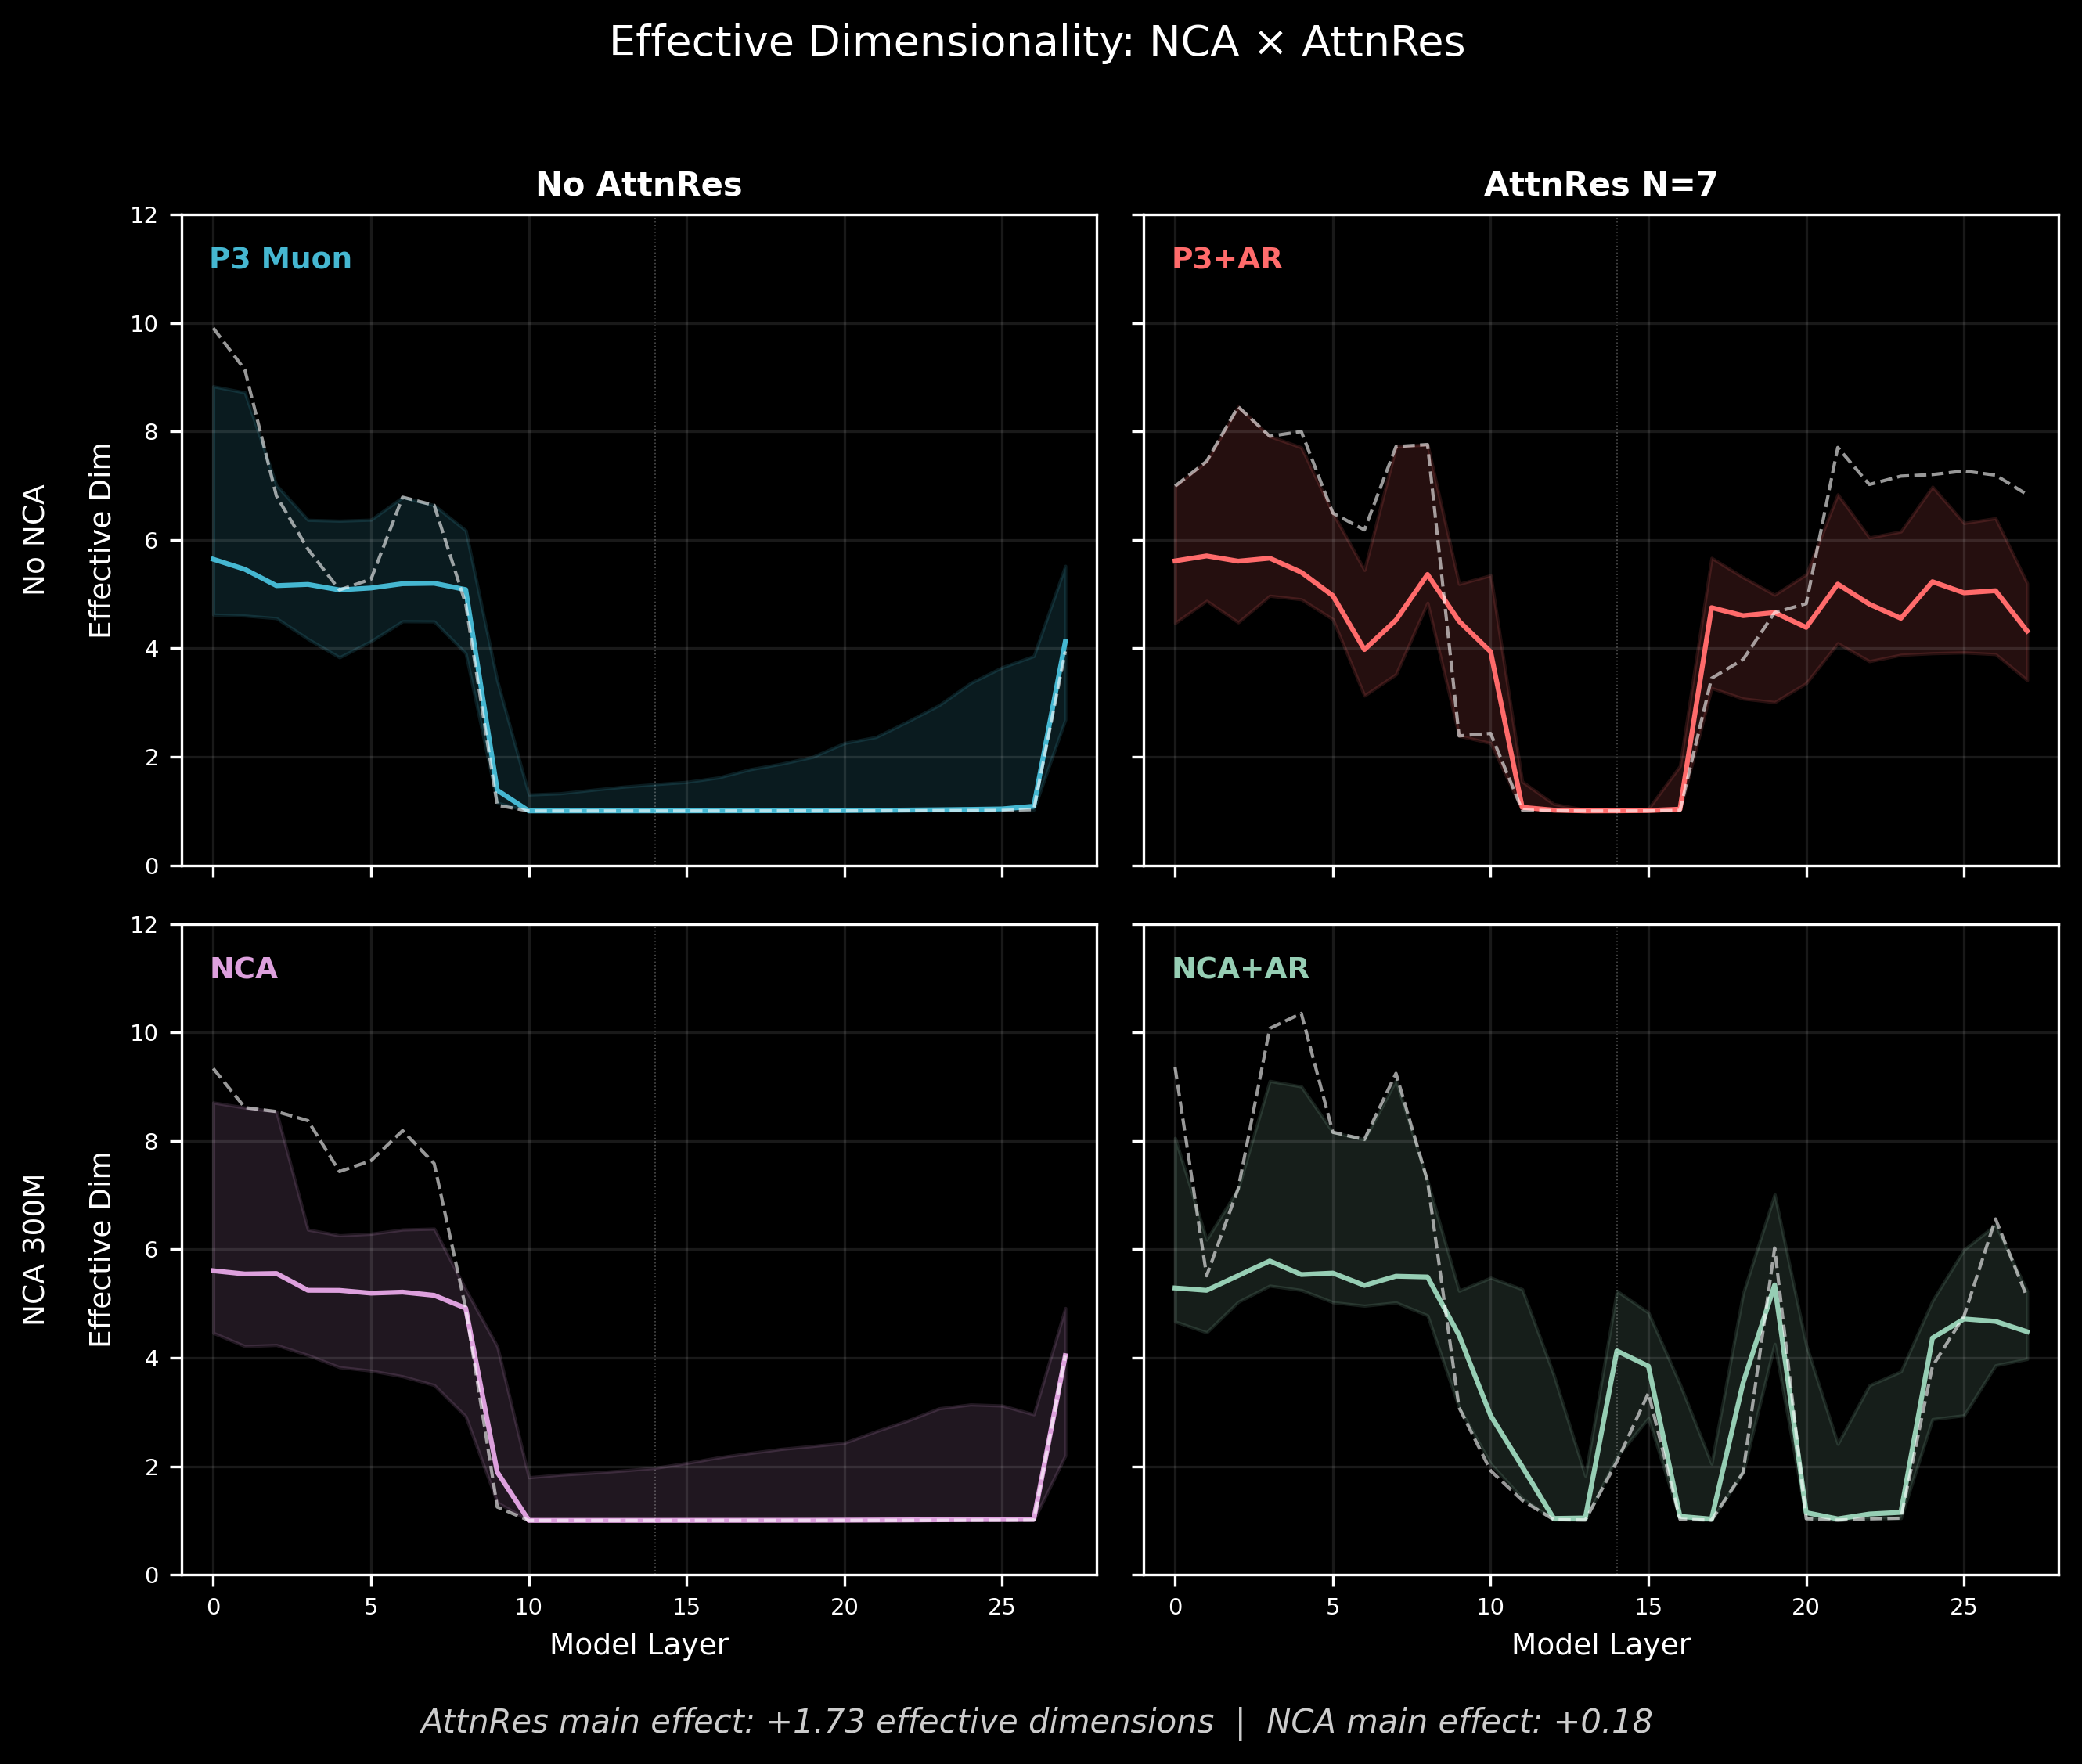
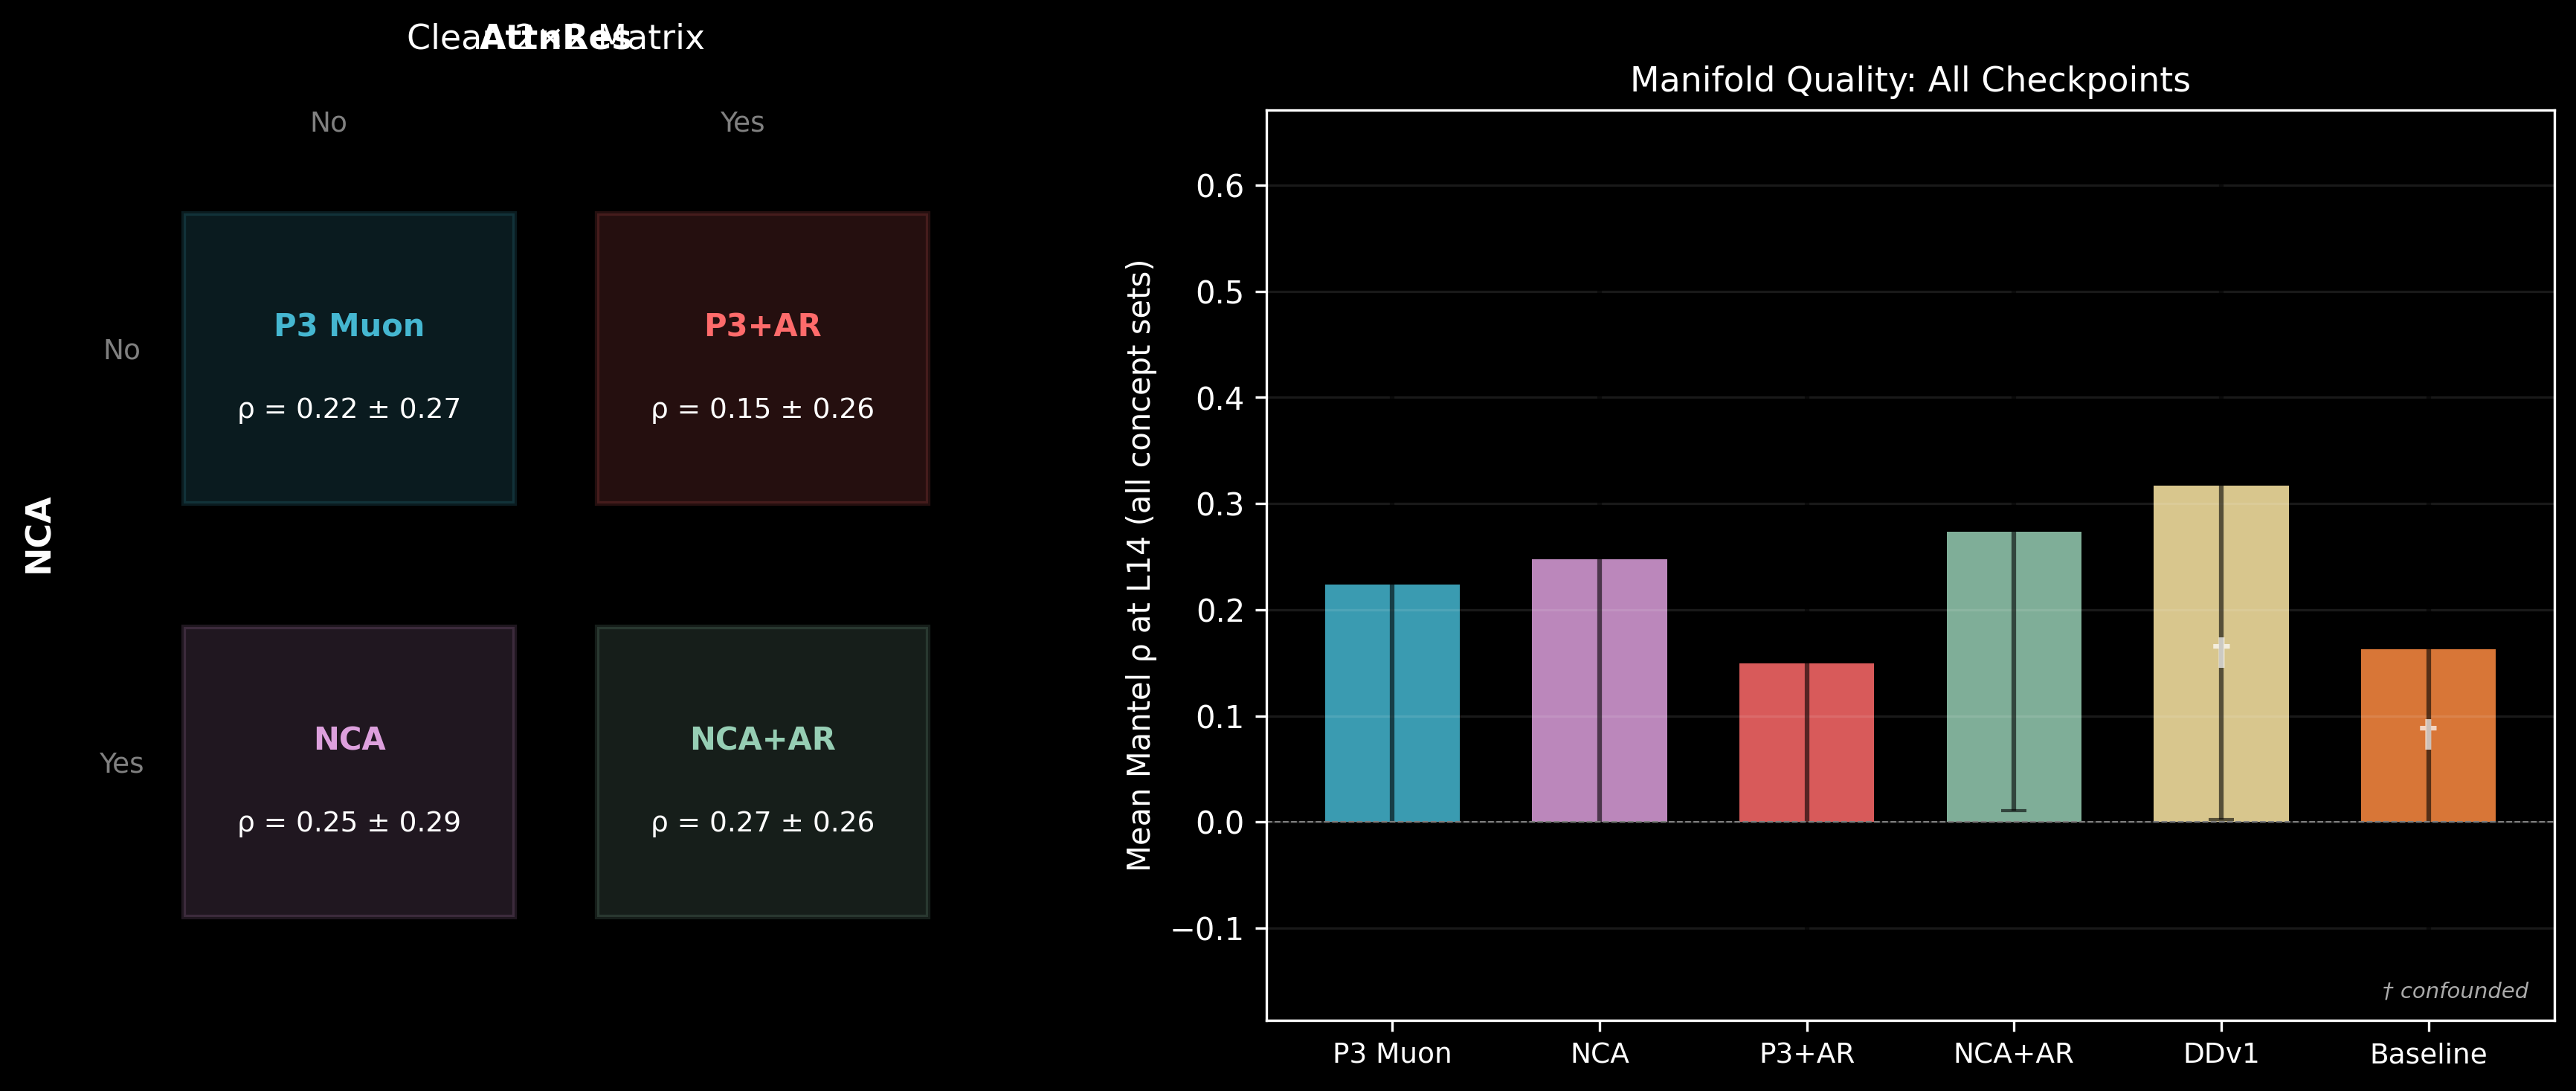
Effective dimensionality at L14 (participation ratio of PCA eigenvalues on concept representations, averaged across 17 concept sets):
| No AttnRes | AttnRes | |
|---|---|---|
| No NCA (P3-Muon, P3-AttnRes) | 1.63 | 1.01 |
| NCA (NCA-002, NCA-AttnRes) | 2.24 | 5.27 |
The clean AttnRes main effect is +1.73 effective dimensions. But the cell-level story is more interesting: P3-AttnRes collapses to 1.01 — worse than no AttnRes at all. Fresh AttnRes without NCA doesn't just fail to help; it actively damages representation quality at this model size. The routing weights start random, and at 512 dimensions, there isn't enough capacity for the model to simultaneously learn useful routing and useful representations during language training.
NCA-AttnRes reaches 5.27 — the highest of any configuration. NCA provides a structured geometric substrate (specialized heads, organized attention circuits), and AttnRes provides the dimensional room for that structure to express itself. Without NCA, AttnRes is headroom with nothing to fill it. Without AttnRes, NCA is structure with no room to breathe.
The head entropy data tells the same story from the weight side:
| Config | L0 Mean | L0 Std | Story |
|---|---|---|---|
| P3-Muon | 5.06 | 0.08 | Near-uniform, undifferentiated |
| P3-AttnRes | 4.61 | 0.12 | Slightly less uniform, still no specialization |
| NCA-002 | 2.95 | 1.14 | Dramatic head rewiring |
| NCA-AttnRes | 2.17 | 1.45 | Most extreme differentiation of any config |
AttnRes alone barely changes head behavior (std 0.12 vs 0.08). But NCA + AttnRes produces the most functionally specialized L0 in the entire ablation: two heads at 0.80 and 0.71 (nearly deterministic), one at 4.06 (still broad). NCA's head rewiring isn't just preserved under AttnRes — it's amplified.
Where AttnRes fails without NCA. The digits concept set shows this cleanly. Ordinal Mantel correlation (representational distance vs. ordinal rank 0–9) at L14:
| Config | Digits rho | NCA? | AttnRes? |
|---|---|---|---|
| P3-Muon | 0.57 | -- | -- |
| NCA-002 | 0.64 | Yes | -- |
| P3-AttnRes | 0.25 | -- | Yes |
| NCA-AttnRes | 0.70 | Yes | Yes |
P3-Muon (no interventions beyond Muon) maintains decent ordinal structure at 0.57. NCA nudges it up. But P3-AttnRes collapses to 0.25 — random routing actively disrupts the structure that standard training builds. NCA-AttnRes recovers to 0.70. The story isn't that NCA + AttnRes is marginally better than NCA alone; it's that AttnRes without NCA is destructive, and NCA prevents that destruction.
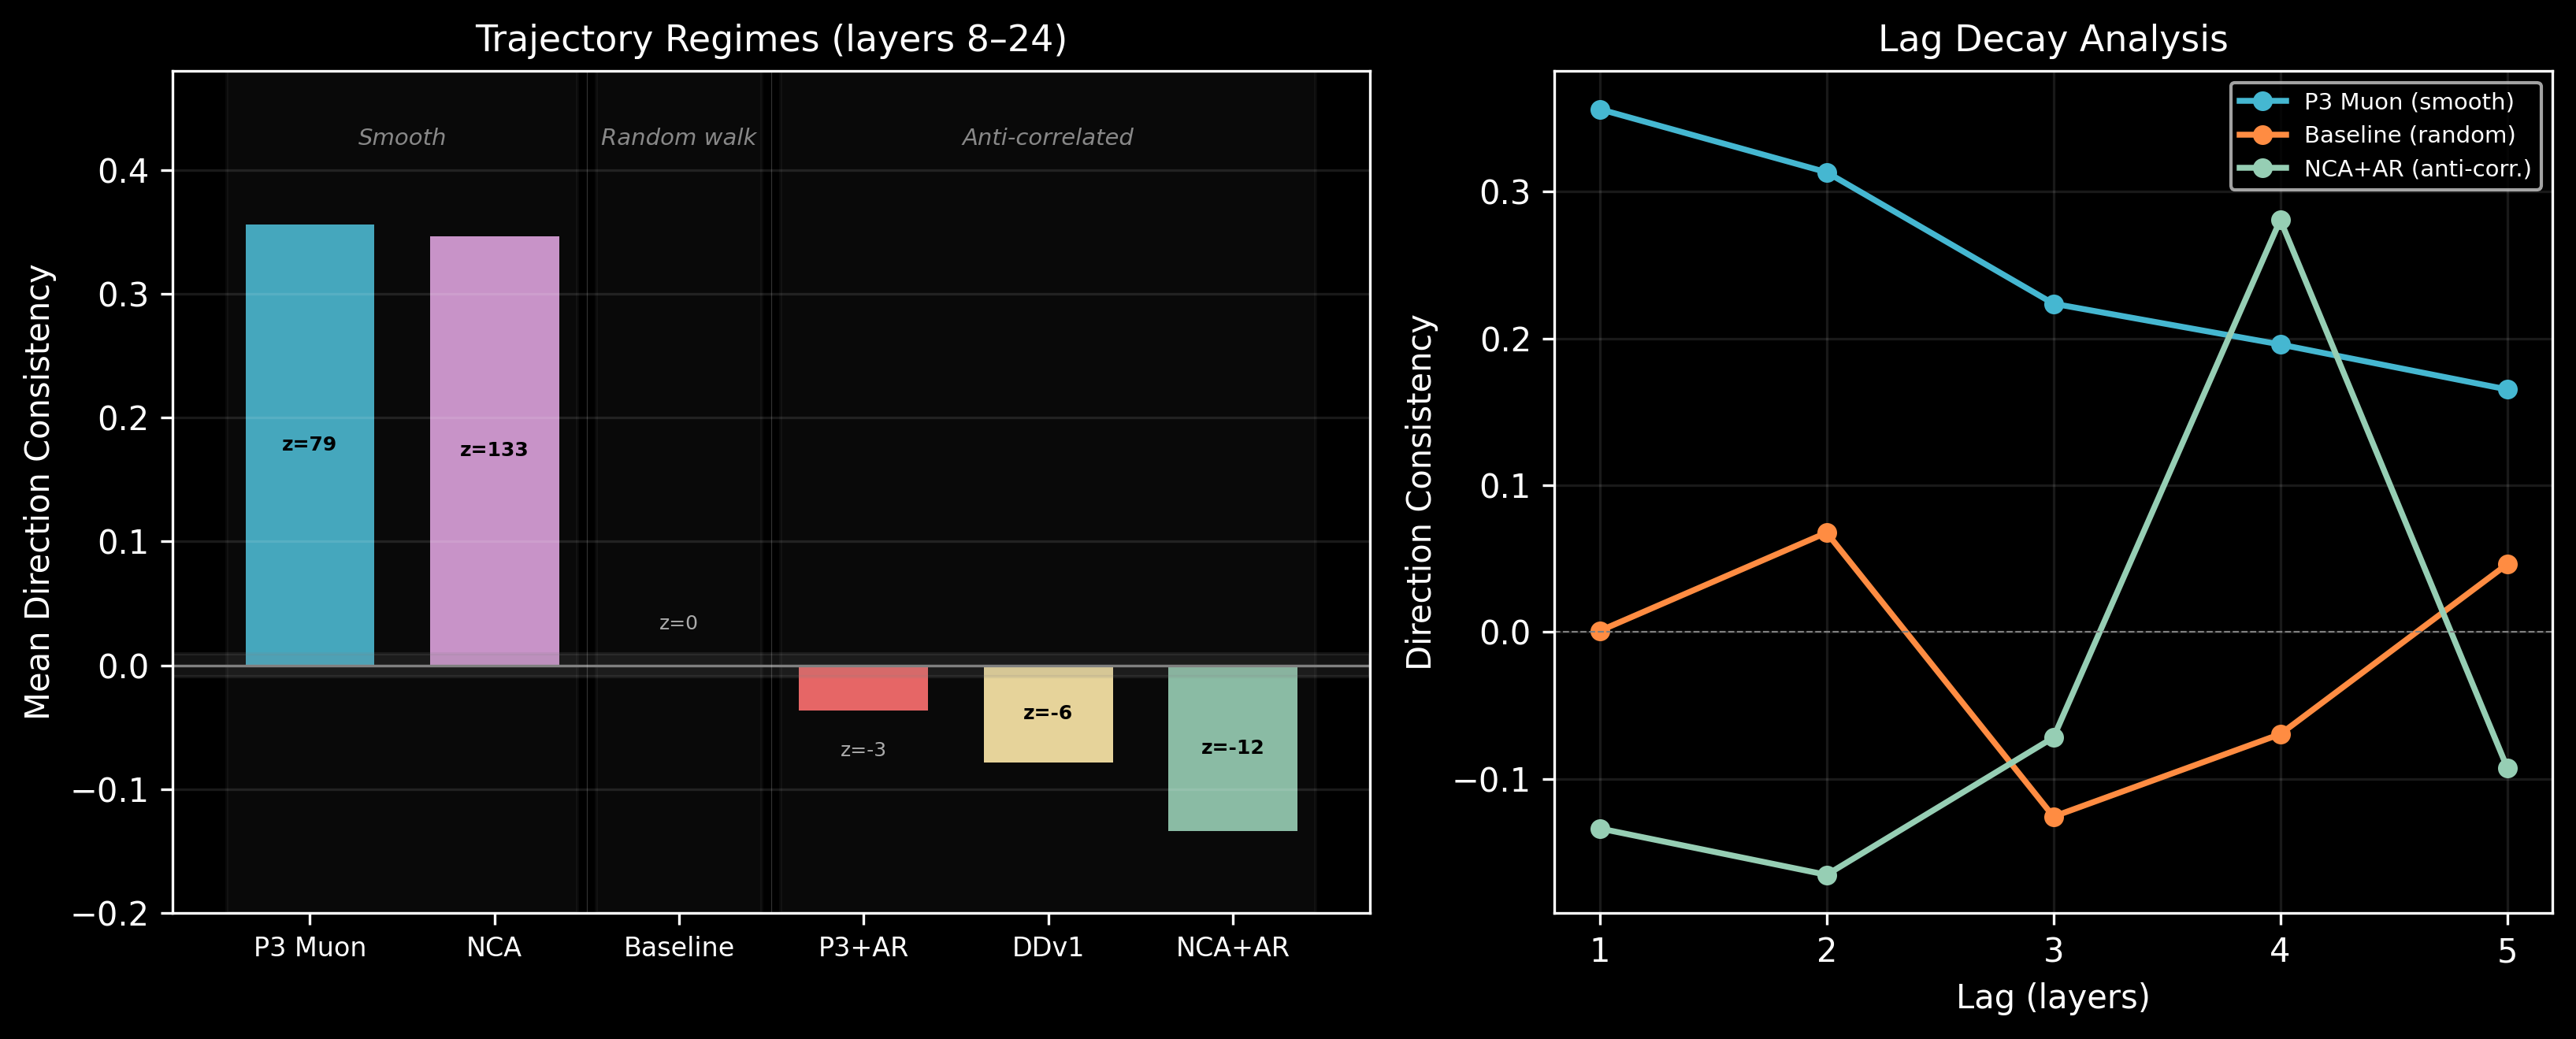
Trajectory regimes. The models also differ in how concept representations vary across layers:
| Config | Mean consistency | Regime |
|---|---|---|
| P3-Muon | +0.356 | Smooth (each layer continues the previous direction) |
| NCA-002 | +0.347 | Smooth |
| Lang-Baseline | +0.001 | Random walk |
| P3-AttnRes | -0.036 | Weakly anti-correlated |
| Lang-DDv1 | -0.079 | Anti-correlated |
| NCA-AttnRes | -0.134 | Strongly anti-correlated (layers zig-zag) |
Standard models process concepts smoothly — each layer refines the previous layer's output. AttnRes models exhibit anti-correlated trajectories, where each layer partially reverses the previous step. This is consistent with the attention bypass architecture: the attention residual and the main residual stream push in alternating directions, creating a zig-zag processing pattern.
5. Co-Training: Smart Design at Small Scale
NCA provides the geometric substrate. AttnRes provides dimensional headroom. But at 108M parameters, they compete for capacity — NCA-AttnRes with uniform N=7 blocks still shows 59% BOS mass at L14, and the effective dimensionality gains come at the cost of the smooth processing trajectories seen in standard models. The interventions help, but they're fighting over 512 dimensions.
Co-training with data-driven block boundaries is how DDv1 resolves this tension. Instead of uniform blocks, the boundaries [0,3,7,12,21,25] were learned alongside NCA pretraining, concentrating capacity where the model needs it. The routing weights enter language training already initialized, rather than starting random.
The result: Lang-DDv1 achieves the lowest L14 BOS mass of any model (51.8%) and maintains it through the full 6B language training run. Lang-Baseline, starting from the same NCA base but with fresh uniform AttnRes, degrades from the P3-Muon level (~86%) to 89.8%.
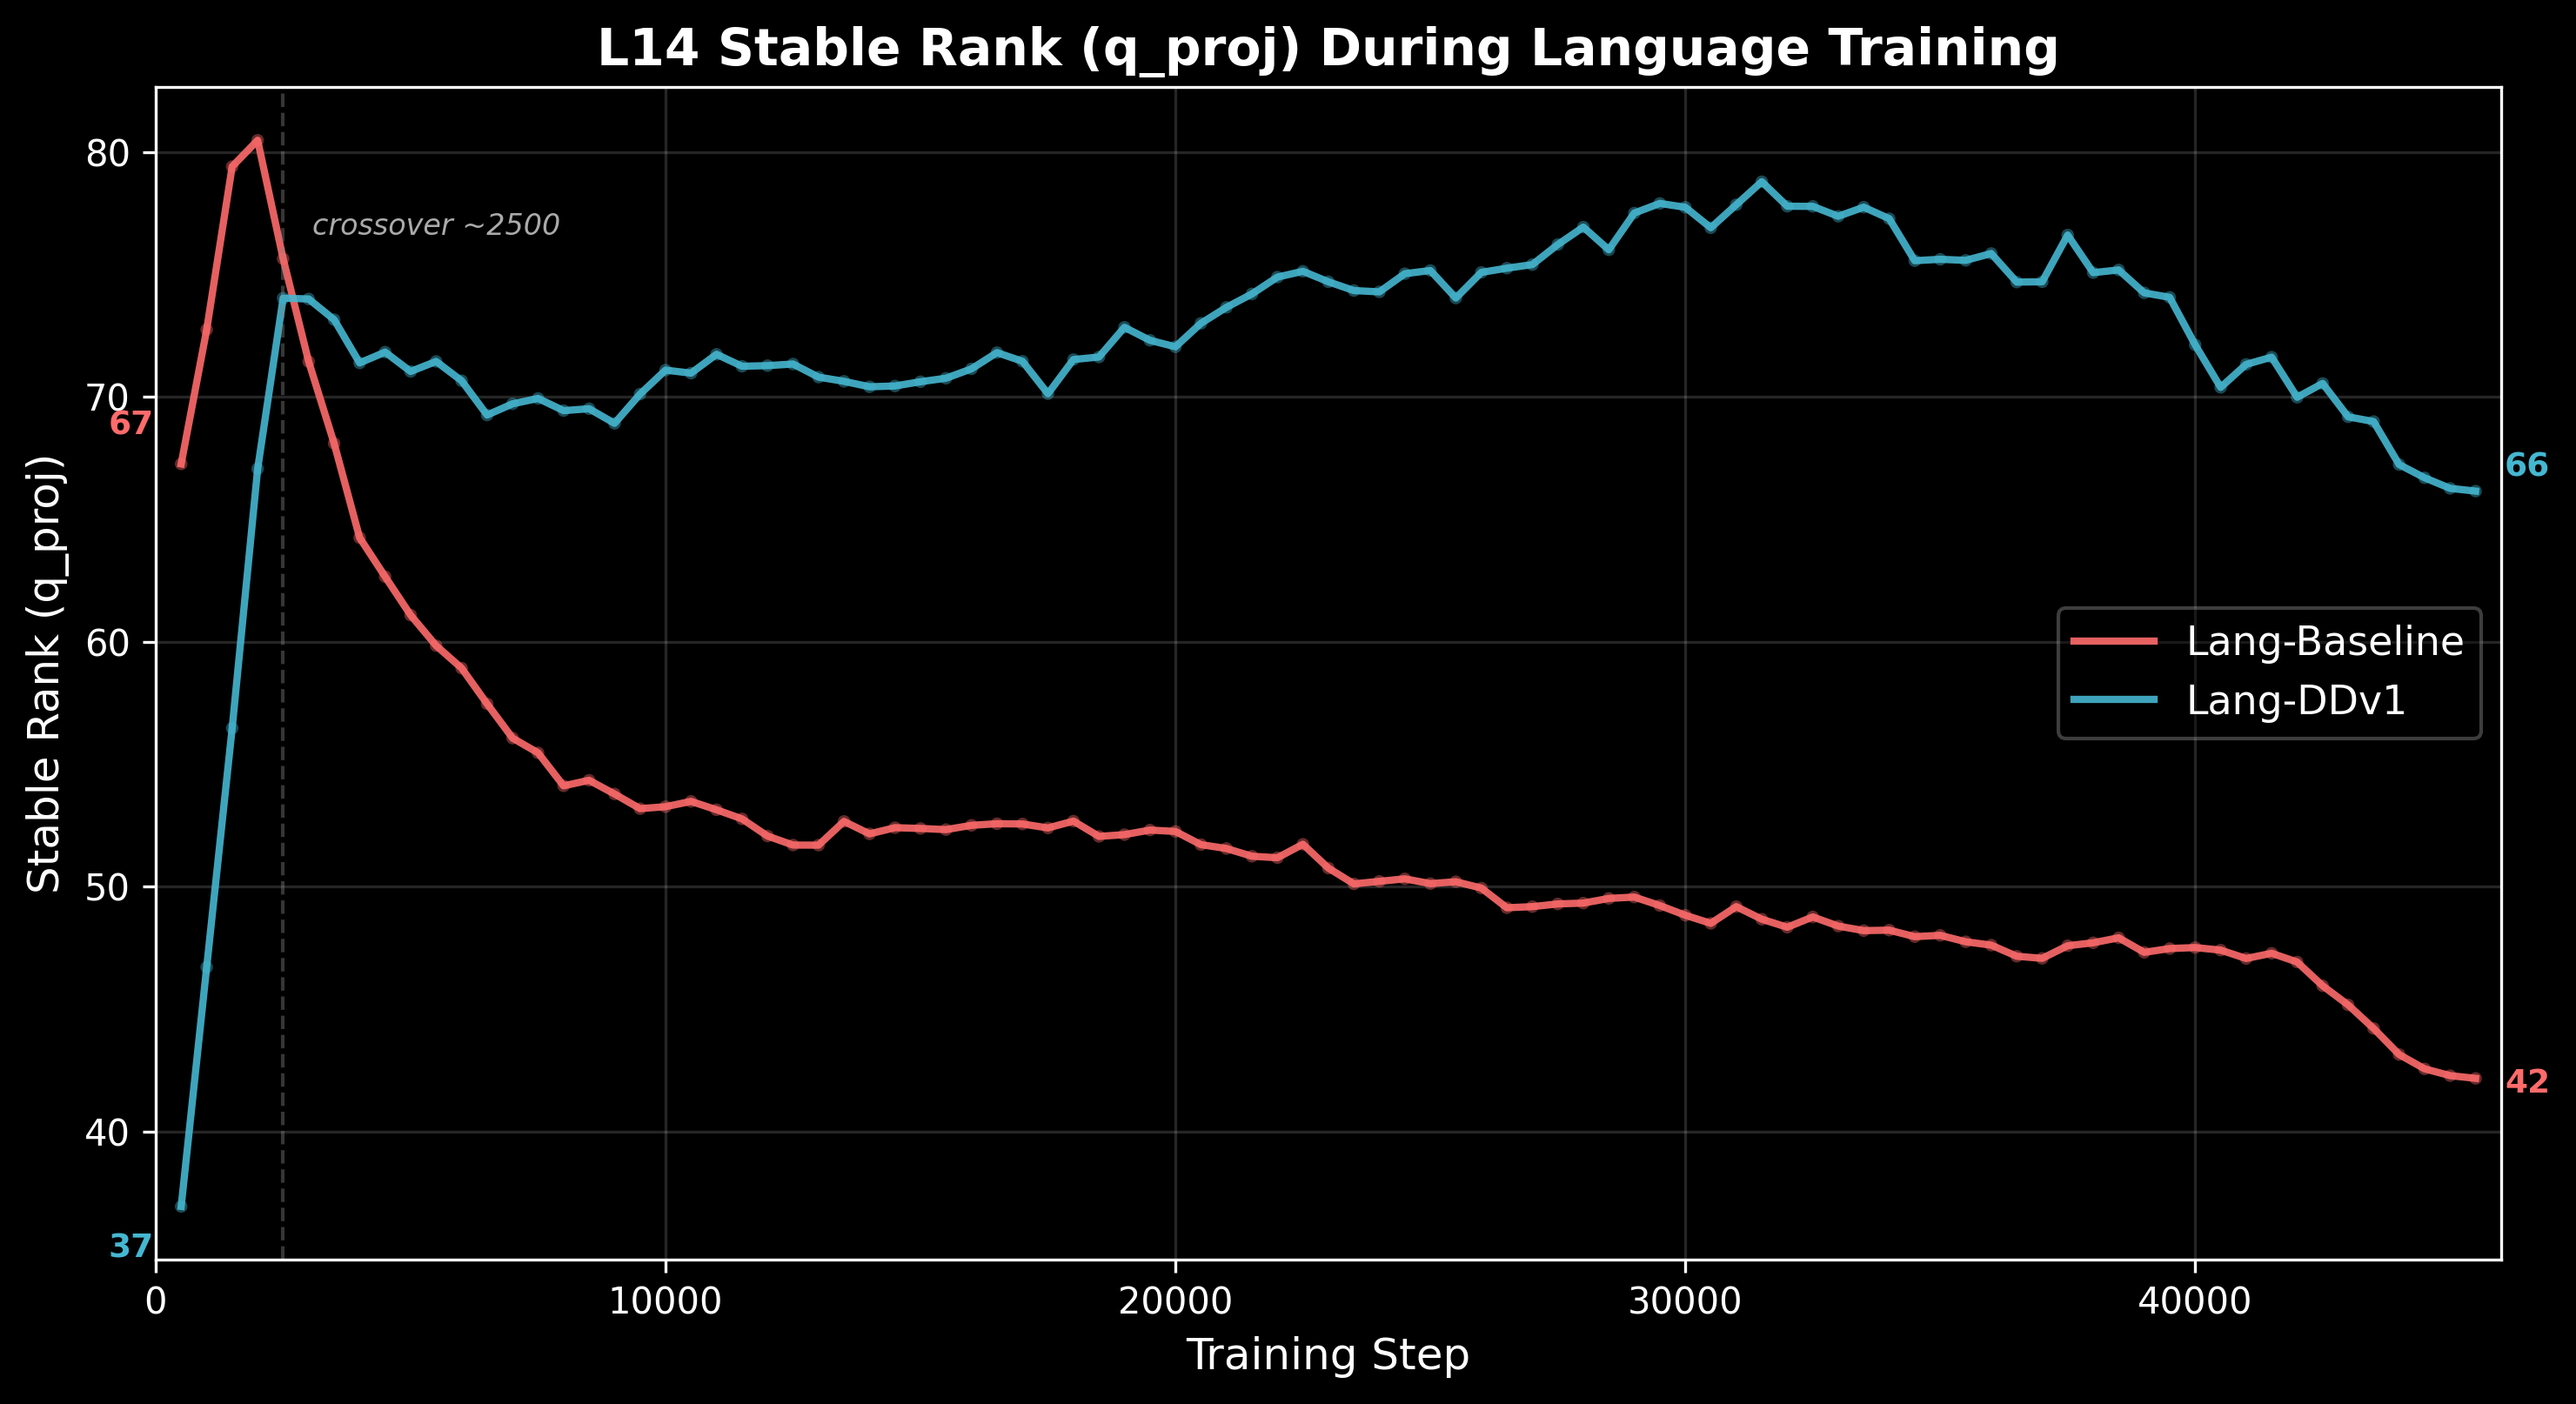
The L14 stable rank trajectories show this divergence playing out over training. Wandb geometric monitoring logged L14 stable rank (q_proj) at 91 checkpoints across the 6B language phase:
- Lang-Baseline: 67 → 42 (starts at the NCA endpoint value, erodes steadily)
- Lang-DDv1: 37 → 66 (starts low due to AR routing redistribution, climbs back)
Lang-Baseline begins language training with the geometric structure NCA built, but without co-trained routing to maintain it, that structure erodes as the BOS-sink develops. Lang-DDv1 starts below (the co-trained AR routing redistributes capacity initially) but converges toward the NCA reference value over training.
Note: wandb training trajectories for the 2×2 matrix runs (P3-Muon, NCA-002, P3-AttnRes, NCA-AttnRes) were lost when the wandb organization was migrated. Only the Lang-Baseline and Lang-DDv1 histories survive. The 2×2 endpoint metrics are preserved in local extractions.
Eigenspectra conservation. Despite these dramatic differences in attention geometry, the total stable rank budget across all layers is approximately conserved between the two models. What changes is the allocation: Lang-DDv1 concentrates its attention capacity in the mid-to-late layers (L14–L27), while Lang-Baseline's capacity erodes at these layers and redistributes to early layers.
A confound disclosure. Lang-DDv1 bundles three changes relative to Lang-Baseline: (1) co-trained routing weights, (2) variable-width block boundaries [0,3,7,12,21,25] vs uniform N=4, and (3) longer NCA duration (852M vs 721M tokens). The missing control experiment — NCA with co-trained routing followed by routing reset at the language transition — would isolate whether the BOS-sink prevention comes from the routing initialization or the block design. This was not run at proxy scale. But the direction is clear: the combination of NCA, AttnRes, and smart block design is where the gains concentrate, and disentangling them matters more at 3B where the capacity constraint relaxes.
6. What the Models Learned
The interventions change the computational machinery. What about the representations themselves?
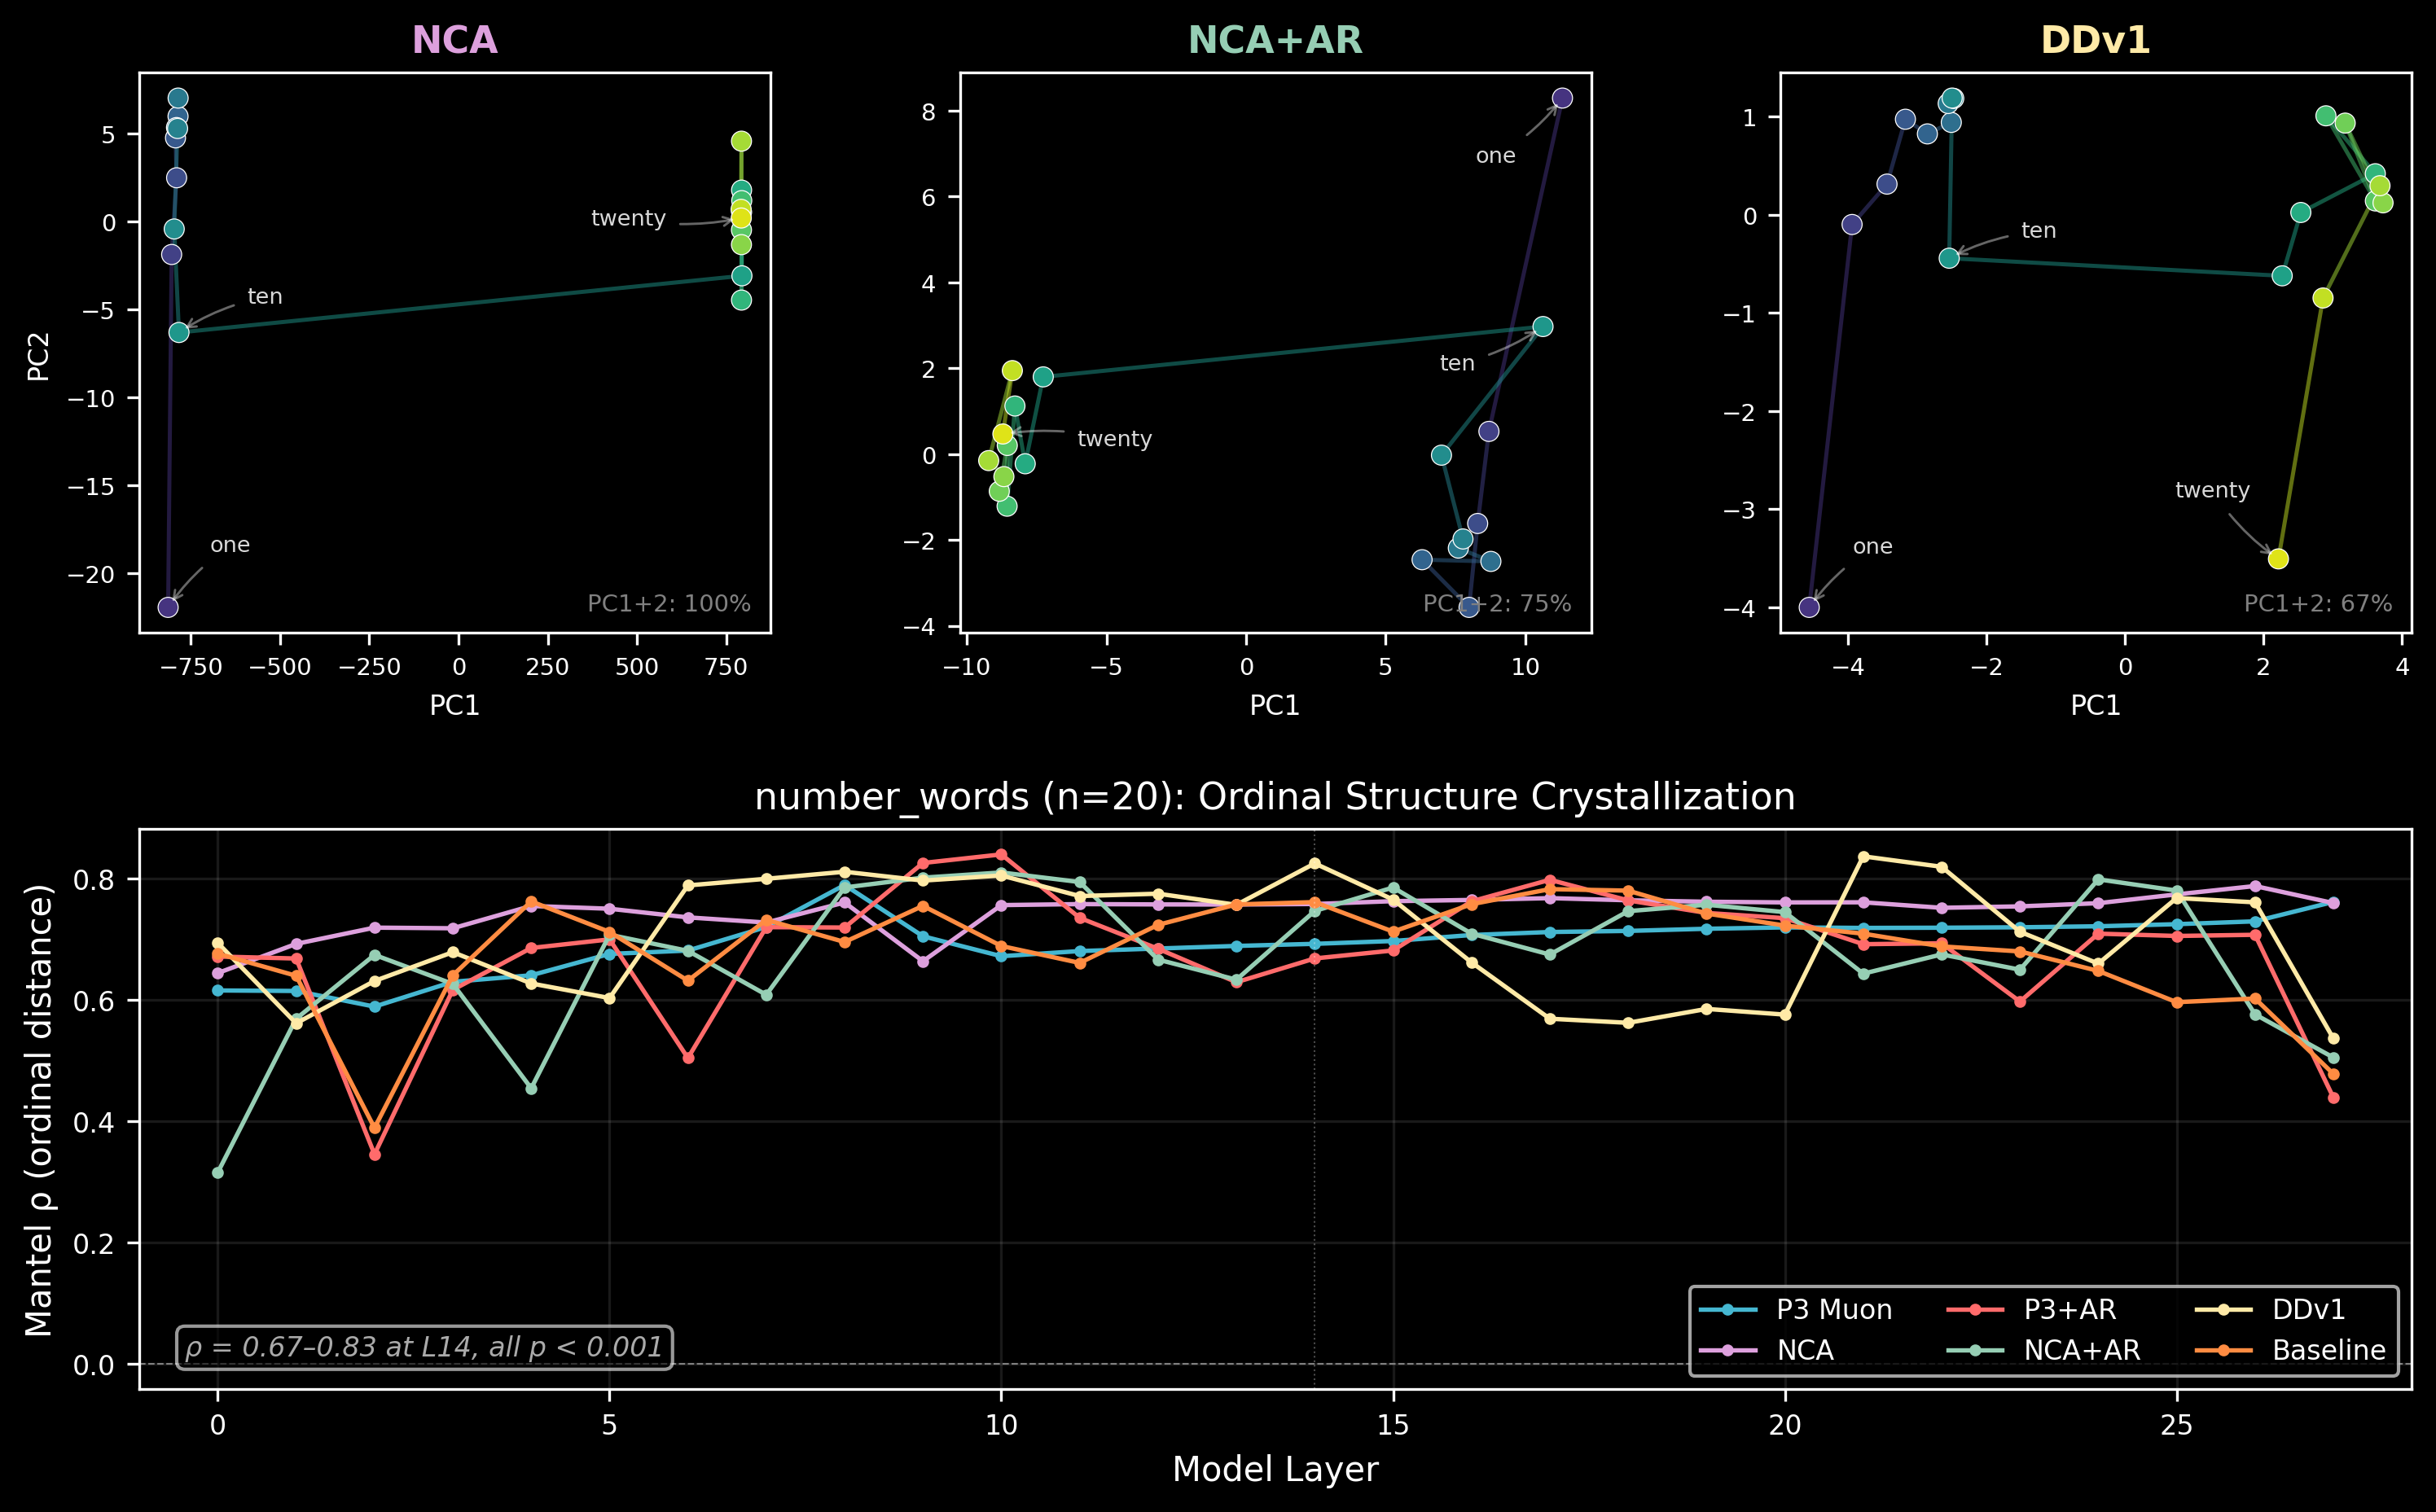
Ordinal structure exists and is data-determined. Feeding concept sets (months, digits, number words, sizes, etc.) through the models and measuring whether representational distances respect ordinal or cyclic structure: they do, in all models. The Mantel correlation between pairwise representational distance and ordinal distance at L14:
| Concept set (n) | P3-Muon | NCA-002 | NCA-AttnRes | Lang-DDv1 |
|---|---|---|---|---|
| number_words (20) | 0.69 | 0.76 | 0.75 | 0.83 |
| digits (10) | 0.57 | 0.64 | 0.70 | 0.70 |
| sizes (8) | 0.59 | 0.54 | 0.44 | 0.46 |
Ordinal Mantel correlations are broadly similar across all models. The data (next-token prediction on FineWeb-Edu) determines the representational geometry of concepts. NCA and AttnRes change the machinery, but the language modeling objective is a strong enough attractor that all models converge to similar concept distance structures.
The exception is the dimensional richness of those representations — the same distances embedded in more or fewer dimensions — which is where the interventions leave their mark (section 4).
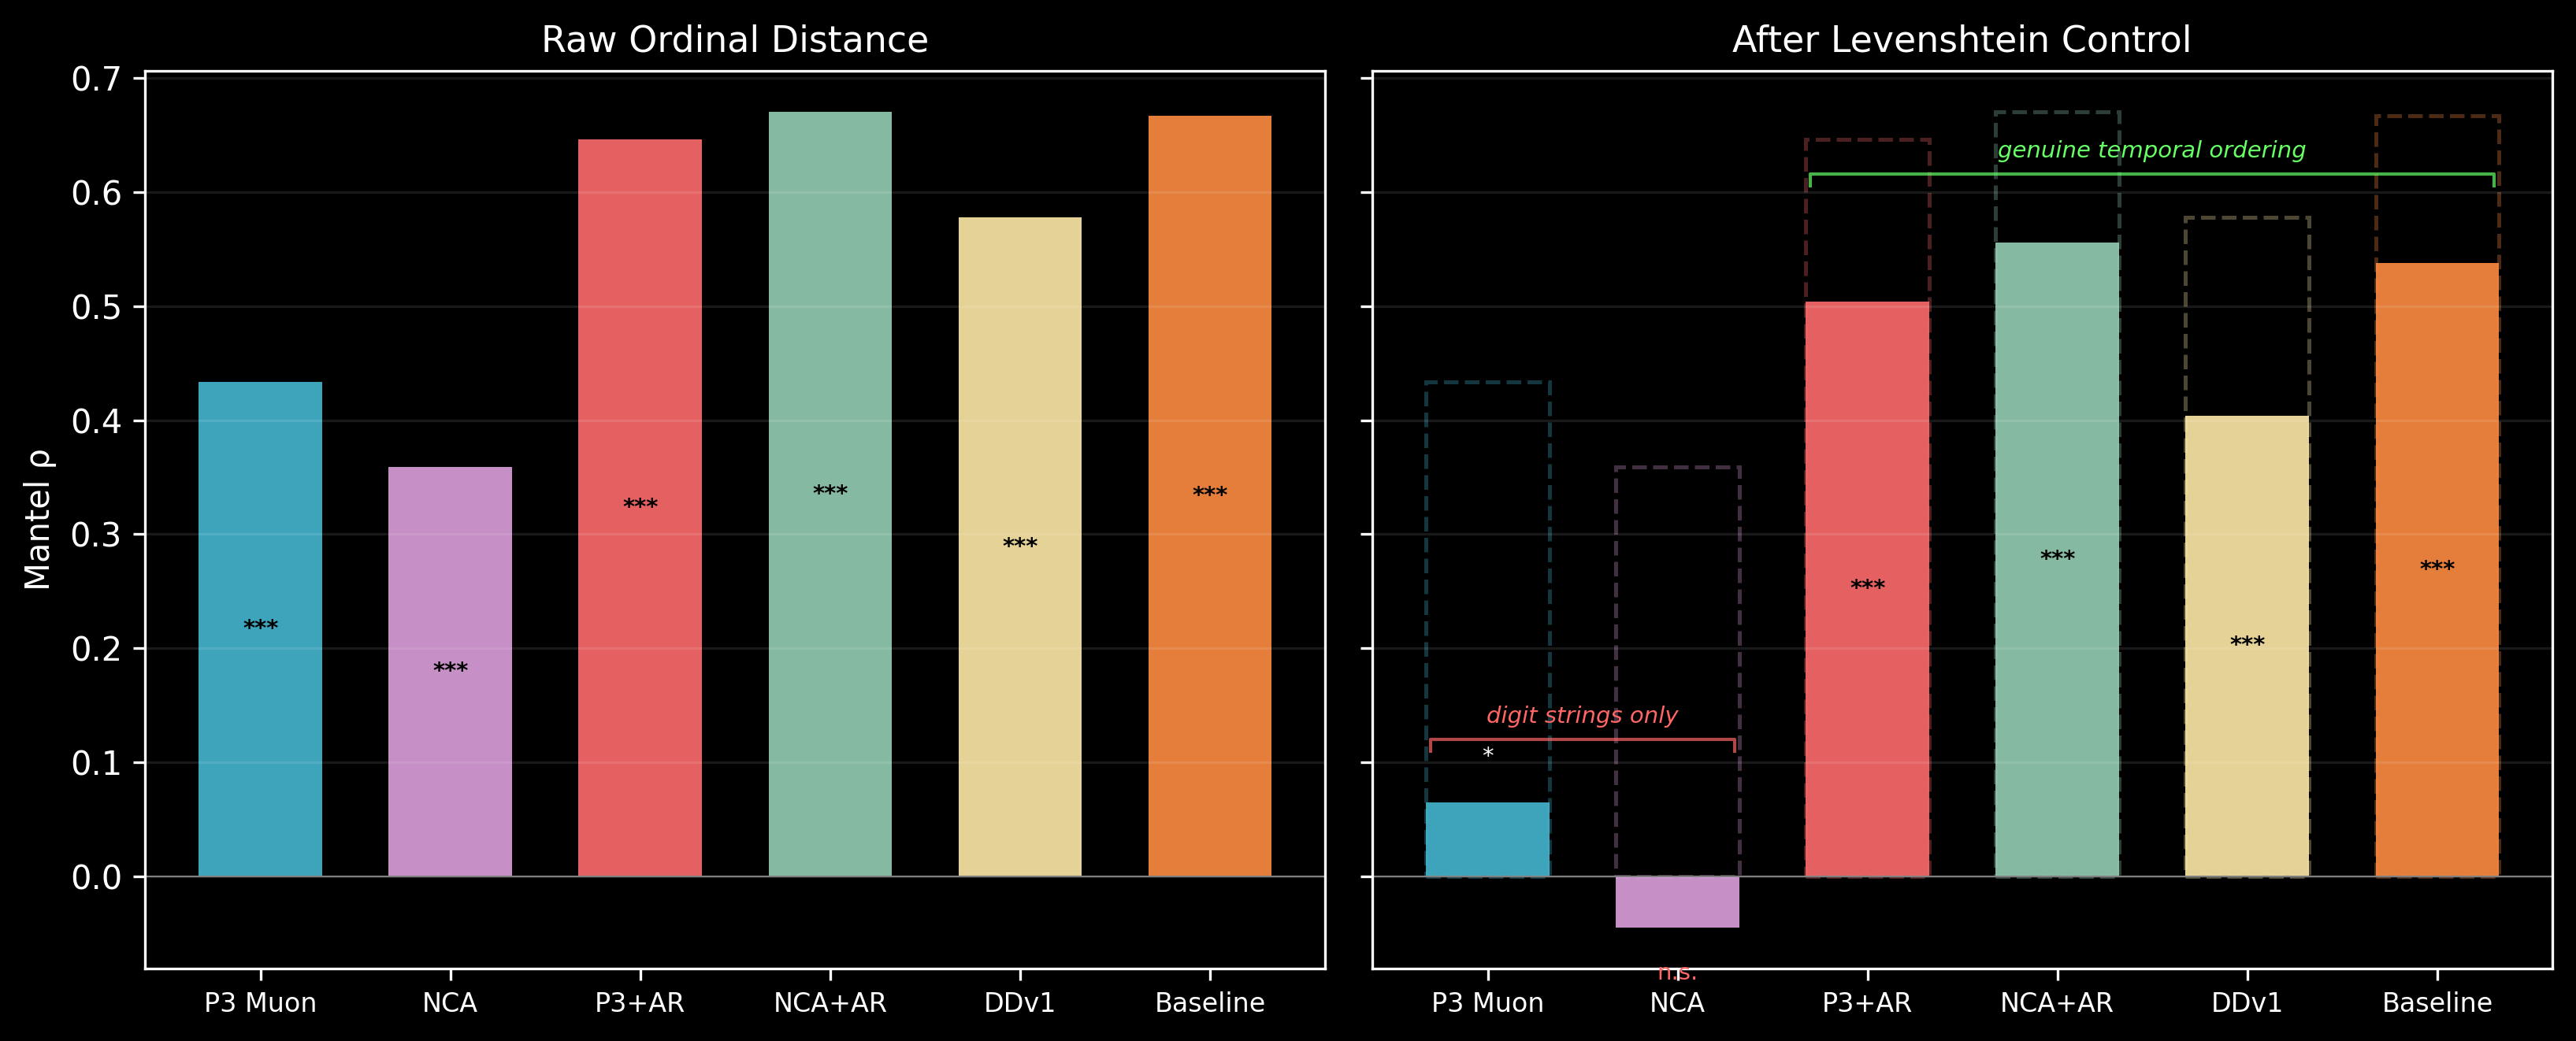
Years: genuine temporal ordering vs. digit-string similarity. The years concept set (1990–2024) presents a confound: "2001" and "2002" are both close in time and close as character strings. Controlling for Levenshtein (edit) distance via partial Mantel test separates temporal ordering from digit overlap:
| Model | Raw rho | Partial rho (Levenshtein-controlled) | R-squared | Interpretation |
|---|---|---|---|---|
| P3-Muon | 0.46 | 0.21 | 4.4% | Digit strings, not time |
| NCA-002 | 0.42 | 0.11 | 1.3% | Digit strings, not time |
| P3-AttnRes | 0.68 | 0.60 | 36.4% | Genuine temporal ordering |
| NCA-AttnRes | 0.70 | 0.60 | 35.6% | Genuine temporal ordering |
| Lang-DDv1 | 0.63 | 0.56 | 31.0% | Genuine temporal ordering |
| Lang-Baseline | 0.69 | 0.62 | 38.2% | Genuine temporal ordering |
Standard models (P3-Muon, NCA-002) encode years primarily as character sequences — after controlling for digit-string similarity, only 1–4% of representational variance reflects temporal ordering. AttnRes models retain 31–38% temporal structure after the control. The practical gap is roughly 30x in explained variance. This is an AttnRes effect, not an NCA effect — the dimensional headroom allows the model to represent temporal ordering in addition to character-level features, rather than being forced to choose one.
US states: geographic structure. States also show geographic Mantel correlation (representational distance vs. physical distance), with NCA-002 strongest (rho = 0.41) and P3-AttnRes weakest (rho = 0.21). This is the inverse of the years pattern — NCA helps geographic structure, AttnRes doesn't. The geographic signal may depend more on attention circuit topology (how the model routes spatial/regional associations) than on dimensional capacity.
What didn't work at 108M. Cyclic structure (months as a circle, compass directions as a ring) remains weak across all models — Mantel rho 0.28–0.45 for months, well below the clean circular manifolds that Karkada et al. found at 2B parameters. Antonym parallelism (hot/cold embedding parallel to big/small) turned out to be a dimensional compression artifact rather than genuine structure. These are capacity limitations, not failures of the approach — 512 dimensions and 108M parameters constrain what the model can represent, regardless of how well the attention circuits are organized.
7. Text Quality: Same Loss, Different Voice
Lang-Baseline and Lang-DDv1 achieve nearly identical evaluation loss (2.892 vs 2.899 nats — a 0.007 nat difference, well within noise). But the text they produce is qualitatively distinct.
Across 25 prompted continuations per model, the semantic profiles diverge systematically:
| Metric | Lang-Baseline | Lang-DDv1 | Ratio |
|---|---|---|---|
| Interrogative sentences | 1.3% | 4.9% | DDv1 3.7x |
| Entity fabrication density | 0.14 | 0.46 | DDv1 3.3x |
| Unique entities per continuation | 7.4 | 9.2 | DDv1 1.3x |
| Noun ratio | 0.24 | 0.28 | DDv1 1.15x |
| Discourse markers | 5.7 | 2.2 | BL 2.6x |
| Dialogue markers | 9.4 | 5.9 | BL 1.6x |
| Referential density (pronouns) | 0.67 | 0.35 | BL 1.9x |
| Clause depth | 2.82 | 2.28 | BL 1.24x |
Lang-Baseline writes like an editorial journalist: discourse markers, dialogue tags, pronominal reference chains, nested clause structures. It builds arguments by linking sentences together. Given "In a surprising turn of events, the researchers discovered that":
Named sources with full titles and institutional affiliations, direct quotes with attribution, discourse scaffolding ("First... Second..."). The model has learned to produce the social infrastructure of text.
Lang-DDv1 writes like an abstract theorist: more questions, more entity introductions, more nouns, fewer connective tissues. Given "The debate between the two philosophers centered on whether":
No named sources, no institutional quotes, no dialogue. It manipulates entities and concepts — "the soul," "the body," "the problem of identification" — through logical-sounding propositions. It name-drops (Einstein, Plato) as concept-bearers, not as people speaking.
Even the collapse modes differ. The AttnRes models develop distinctive failure patterns absent from standard runs. NCA-AttnRes, given "The debate between the two philosophers," veers into a numbered list and then cannot stop incrementing:
P3-AttnRes, by contrast, collapses into lexical enumeration — generating varied entity names until one becomes the loop attractor:
Both models loop at this scale — that's an unavoidable property of 108M parameters. But the style of coherent output and the structure of collapse differ systematically across configurations. The loss function cannot see any of this, which is precisely the point: the interventions create different computational paths through an equivalent loss landscape.
Connecting geometry to output. Why would lower BOS-sink and higher effective dimensionality produce different text? The mechanism is plausible if not proven: Lang-DDv1 has more intermediate layers doing actual computation (51.8% vs 89.8% BOS mass at L14), which means richer hidden states available at generation time. Higher effective dimensionality (4.39 vs 2.17 at L14) means the model represents more aspects of each concept simultaneously. A model with more internal structure to draw on generates more entity-dense, concept-driven text; a model whose deep layers are largely disabled falls back on surface-level discourse scaffolding — quotes, attributions, connective phrases — because that's what the surviving shallow computation can produce. This is speculative, but the three measures (BOS-sink, effective dimensionality, text style) all point the same direction.
8. The Full Picture
Take a step back. Every model in this ablation predicts the next token about equally well. The loss spread across all seven configurations is 0.06 nats. If loss were all that mattered, you'd pick whichever trained fastest and move on. But you can't evaluate training quality from a loss curve alone — and here's proof.
Seven models, identical loss, demonstrably different internal organization with measurable downstream consequences in generation. The practical implication: geometric monitoring during training (stable rank profiles, head entropy, BOS concentration) captures information about model health that loss simply cannot.
Representational orthogonality. The cosine similarity between principal component directions of hidden states, across six model pairs:
| Pair | Loss delta | L0 PC1 | L14 PC1 | L27 PC1 |
|---|---|---|---|---|
| P1-AdamW vs P3-Muon | 0.000 | 0.003 | 0.072 | 0.028 |
| P3-Muon vs NCA-002 | 0.006 | 0.010 | 0.128 | 0.027 |
| P3-AttnRes vs NCA-AttnRes | 0.016 | 0.061 | 0.010 | 0.034 |
| P1-AdamW vs NCA-002 | 0.006 | 0.024 | 0.042 | 0.008 |
| P3-Muon vs P3-AttnRes | 0.055 | 0.035 | 0.028 | 0.036 |
| Lang-Baseline vs Lang-DDv1 | 0.007 | 0.068 | 0.039 | 0.021 |
Grand mean |cosine| = 0.043, versus a random baseline of 0.035 in 512 dimensions. Every pair is effectively orthogonal. P1-AdamW and P3-Muon — identical loss to three decimal places — show PC1 cosine of 0.003 at L0. The pair with the largest loss gap (P3-Muon vs P3-AttnRes, 0.055 nats) is no more aligned than the zero-delta pair.
The loss surface has many basins that look identical from the outside but are orthogonally oriented on the inside. What makes this actionable rather than just theoretically interesting is that the initialization pathway controls which basin the model lands in — and the basins have measurably different properties (BOS-sink severity, representational dimensionality, text generation style). The degeneracy is known; the controllability and downstream consequences are the contribution.
Intrinsic dimensionality converges anyway. Despite orthogonal representations, the TwoNN intrinsic dimension at L27 converges to approximately 6.3 for both lang-full models. The hidden state manifold's topology — its intrinsic complexity — is data-determined even when the embedding of that manifold in 512-dimensional space differs completely between models.
The MLP null control. Across every intervention, the MLP pathway is remarkably stable. Computing eigenspectra divergence between model pairs:
| Intervention step | Attention divergence | MLP divergence | Ratio |
|---|---|---|---|
| Muon (P1-AdamW vs P3-Muon) | 10.9% | 2.9% | 3.7x |
| NCA (P3-Muon vs NCA-002) | 4.8% | 1.6% | 3.0x |
| Full bundle (Lang-Baseline vs Lang-DDv1) | 4.4% | 1.3% | 3.3x |
At every step, attention diverges 3–4x more than MLP. Muon is the largest spectral perturbation (10.9% attention, mostly in q_proj and o_proj). NCA adds another 4.8%. But MLP projections barely move — 1.3–2.9% regardless of what happens to attention. The interventions change where computation is routed (attention circuits) without disturbing what computation happens (MLP feature extraction).
What are the extra dimensions for? AttnRes adds +1.73 effective dimensions to concept representations. But ordinal Mantel correlations are broadly similar across models. If the extra dimensions don't improve ordinal fidelity, what do they encode?
The years partial Mantel test suggests an answer: the extra dimensions encode additional structure that coexists with ordinal relationships rather than replacing them. Standard models are forced to collapse year representations onto a single axis (character similarity), because they lack the dimensional room for anything else. AttnRes models can simultaneously represent character similarity and temporal ordering. The text quality findings point in the same direction — richer internal structure manifesting as a more concept-driven, entity-rich generative style rather than improved loss.
9. Implications for 3B
The configuration is locked: DDv1 (NCA + co-trained DD-v1 AttnRes + Muon 0.02 + data curation). Here's what to watch for at scale.
The capacity tension should resolve. At 108M with 512 hidden dimensions, NCA and AttnRes compete for capacity — P3-AttnRes collapsing to 1.01 effective dimensions is a direct consequence of this bottleneck. At 3B with 3072 hidden dimensions, there is 6x more representational room. The synergy between NCA's geometric substrate and AttnRes's dimensional headroom should strengthen, not weaken. Whether the competitive dynamics we observed (NCA weakening the BOS-sink to 75%, AttnRes cutting it to 52%, smart design maintaining that through training) still hold, or whether the larger model simply resolves all of them, is the first thing to measure.
Block boundaries matter. DDv1's variable boundaries [0,3,7,12,21,25] were co-trained with NCA's spatial patterns at 108M/28 layers. At 3B the optimal boundaries may differ — more layers means more possible configurations. The data-driven boundary selection should be re-run.
BOS-sink re-emergence. The BOS-sink appeared in Lang-Baseline despite NCA pretraining — fresh AttnRes routing lost the NCA geometric structure over 6B language tokens. At 3B with longer training runs, even co-trained routing could potentially erode. Monitoring L14 stable rank during training is essential.
Cyclic structure. Monthly and directional concepts show weak cyclic structure at 108M (Mantel rho 0.28–0.45). Karkada et al. found clean circular representations at 2B parameters. Whether Kotodama develops these at 3B is an open question and a good early signal of representational health.
Early diagnostic: the zig-zag signature. The anti-correlated trajectory pattern in AttnRes models (section 4) is the cheapest thing to check at 3B. It requires a single forward pass on a handful of examples. If DDv1 at 3B still shows anti-correlated layer-to-layer consistency while a baseline doesn't, the AttnRes processing mechanism transferred. If both are smooth, the zig-zag was a capacity artifact. Either answer is informative within the first few hundred million tokens of training.
Appendix: Data Sources
All statistics in this report were recomputed from raw data and persisted to JSON files in pretraining/luxia-base/data/. For any number cited above, trace to the source file:
| Statistic | Source file |
|---|---|
| BOS attention mass (all 9 models) | data/report_bos_mass_all_models.json |
| Per-intervention eigenspectra divergence | data/report_per_intervention_eigenspectra.json |
| Cross-pair PC cosine (6 pairs) | data/report_cross_pair_pc_cosine.json |
| Head entropy (all 7 proxy models, 28 layers) | data/report_head_entropy_full.json |
| Eigenspectra divergence (lang-full pair) | data/report_summary_stats.json |
| Point cloud PCA, head entropy (sweep) | data/report_summary_stats_v2.json |
| Years Levenshtein (5 seeds x 5000 perms) | data/report_levenshtein_stability.json |
| US states geographic Mantel | data/report_states_and_levenshtein.json |
| Ordinal/cyclic Mantel, trajectory smoothness, subspace dim | outputs/shapes/manifolds/v2_analysis_results.json |
| Wandb geometric histories (lang-full pair, 136 steps) | data/wandb_history_lang_full_{baseline,ddv1}.json |
| Text quality (25-sample profiles) | data/lang_full_text_quality_multisample.json |
| Eval loss/PPL | data/proxy_sweep_eval_results.json, data/lang_full_eval.json |
Stable rank disambiguation. Two formulas appear in the codebase:
- Wandb monitoring:
SR = ||W||_F^2 / sigma_max^2(values 30–80 for q_proj) - Eigenspectra extraction:
PR = (sum sigma)^2 / sum(sigma^2)(values 170–450 for q_proj)
Both are valid measures of spectral spread. This report uses the wandb formula for training trajectories and the participation ratio for endpoint comparisons, and labels which is which.
Raw data. Per-head entropy: outputs/shapes/extracted/head_entropy.npz. Attention weights: outputs/shapes/extracted/attention_weights.npz (2×2 matrix) and outputs/shapes/extracted_lang_full/attention_weights.npz (lang-full pair). Eigenspectra: same directories, eigenspectra.npz.
Manifold analysis plots. Paper-quality figures in outputs/shapes/manifolds/plots/paper_v3/:
fig1_ordinal_hero.png— PCA scatter + crystallization curvesfig2_trajectory_regimes.png— three-regime bars + lag decayfig3_subspace_2x2.png— effective dimensionality 2×2 factorialfig4_years_levenshtein.png— raw vs partial Mantel barsfig_s1_subspace_heatmap.png— full 6-checkpoint effective dim heatmapfig_s4_intervention_summary.png— quality null summary
Attention heatmaps. Per-head attention patterns in outputs/shapes/plots/:
attention_no_bos_muon_vs_nca_layer_14.png— BOS-sink visual evidence at L14attention_no_bos_adamw_vs_muon_layer_14.png— AdamW vs Muon comparisonper_head_attention_nca.png— NCA head specialization gallery
Training trajectories. outputs/shapes/plots/l14_sr_trajectory.png — L14 stable rank divergence during language training.